Welcome to the Gold price forecast May 04 2026 Asia open. Gold (XAU/USD) is trading at $4,613.16 as the Asian session begins, showing a neutral stencil after a quiet weekend close. The precious metal enters the week with a balanced technical posture – the 20 and 50 EMAs are converging near $4,612 and $4,608 respectively, while the RSI sits at 51.09, perfectly neutral. Bulls are eyeing the first resistance at $4,646.73, while support holds at $4,510.31 and $4,657.63. For traders looking to automate their reaction to these levels, our AI Trading Bot runs 24/7 on XAU/USD and can execute breakout or mean-reversion strategies without emotion.
Gold Market Overview
Gold enters the new trading week on a relatively even keel. On Friday, the metal closed at $4,613.16 after posting a modest gain of 0.5% as the US Dollar weakened following Japan’s currency intervention. The USD Index drifted lower alongside falling oil prices (Brent below $100) and lower Treasury yields – the 10-year yield slipped 2.2 basis points to 4.36%. Geopolitical headlines from the Middle East continue to offer a bid for gold, but the threat of higher-for-longer US interest rates remains a ceiling. Fed’s Kashkari warned that the Iran conflict may raise inflation risks and prevent rate cuts, while Fed’s Barr highlighted private credit stress. Overall, the market mood is cautious, with traders waiting for high-impact data later in the week: ISM Services PMI and JOLTS Job Openings on Wednesday.
Technical Analysis
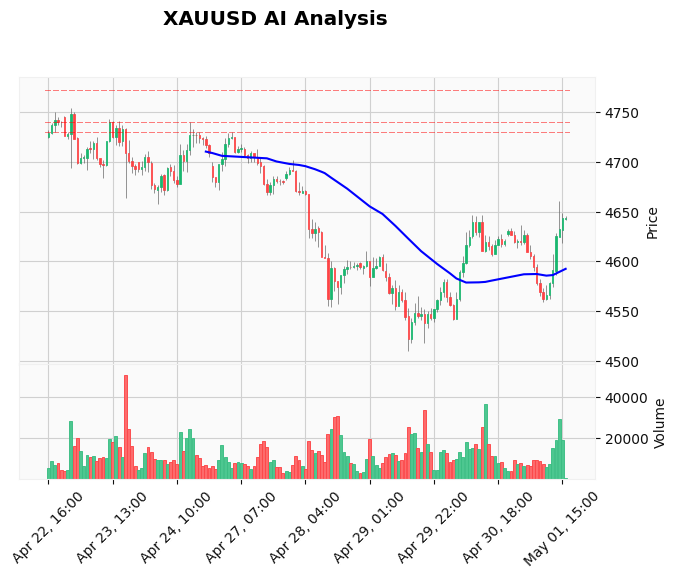
The 60-minute chart shows price consolidating around the 20-period EMA at $4,612.82, which is serving as dynamic support. The 50-period EMA at $4,607.69 lies just below, reinforcing the immediate floor. The 200-period EMA at $4,652.58 is well above the current price, indicating that the longer-term trend remains somewhat bearish, but the medium-term structure is neutral. The RSI at 51.09 shows no overbought or oversold pressure, allowing for both upward and downward continuation.
Key resistance levels: R1 at $4,646.73 – a break above this opens the path toward R2 at $4,889.44. On the downside, immediate support is the S1 of $4,510.31, but before that, the $4,600 round number and the EMAs provide a cushion. The MACD is slightly below its signal line (4.28 vs 4.35), hinting at waning short-term bullish momentum. The ATR of $18.21 reflects average daily volatility of roughly $18, which is moderate. Traders should watch for an intraday breakout above $4,620 or a breakdown below $4,600 to set the tone for the session. Our Price Action Pro EA can help identify these early breakout patterns automatically.
Fundamental Drivers
The primary driver for this session is the ongoing geopolitical tension in the Middle East, which keeps safe‑haven demand alive. Additionally, the US Dollar’s weakness – exacerbated by Japan’s intervention and lower oil prices – supports gold. However, Fed officials remain hawkish. Kashkari’s comments over the weekend suggest that rate cuts are off the table for now, and that a rate hike is not ruled out if inflation picks up due to energy prices. This keeps a lid on gold’s upside. No high-impact US data is due until Wednesday, so volatility may remain subdued until then. For news‑based trading, consider using our News Trading Bot which reacts instantly to key economic releases.
Devil's Advocate
While the immediate picture is neutral, we must consider that the daily chart remains bearish overall. If price fails to hold above $4,600 and closes below the 50 EMA, expect a retest of support at $4,510. Furthermore, any hawkish surprise from Fed speakers or a sudden risk‑on mood – perhaps due to progress in geopolitical talks – could trigger a sharp drop. The key invalidation level for the bullish case is a break below $4,600, while a sustained move above $4,620 would negate the bearish scenario. Stay flexible.
Trading Strategy for This Session
Given the neutral RSI and price near the EMAs, the best approach for the Asian session is to wait for a clear trigger. A long setup above $4,620 targets R1 at $4,646, with a stop below $4,600. A short setup below $4,600 targets support at $4,570 and then $4,510, with a stop above $4,620. Given the moderate volatility (ATR $18), aim for a reward‑to‑risk ratio of at least 2:1. For automated execution, our live Gold trading signals provide real‑time entries and exits for these exact levels.
Risk Management
Position sizing should reflect the current volatility. With $18 ATR, a standard 1% account risk would allow for a position size where the stop loss distance equals the ATR. For example, a $13,000 account risking 1% ($130) could trade 0.07 lots if the stop is $18. Always set a mental stop and trail once in profit. If price chops around the EMAs, reduce size or avoid trading until a breakout occurs. Remember: the best trades often come after the first hour of the session when liquidity returns.
FAQ
Q: Should I trade gold during the Asian session?
A: Yes, but expect lower volatility compared to London or New York. Support and resistance levels often hold better during Asia, making it a good session for range‑bound strategies. Always wait for price to test key levels before entering.
Q: What is the next major resistance for gold?
A: The immediate resistance is at $4,646.73 (R1). Above that, the 200‑period EMA at $4,652.58 and then the major supply zone near $4,889.44 become targets. A weekly close above $4,890 would signal a stronger bullish shift.
Q: How does the Fed's stance affect gold today?
A: The Fed's hawkish tone limits gold's upside because higher rates increase the opportunity cost of holding gold. However, if data later in the week comes in weak, expectations for cuts could revive, boosting gold. For now, the neutral price action reflects this tug‑of‑war.
Q: What time does the US session for gold start?
A: The New York session for gold effectively begins at 8:00 AM EST (13:00 GMT). This is when liquidity spikes and breakouts often occur. The Asian session should be seen as a building block for that volatility.
Conclusion
Gold’s Asian open at $4,613 reflects a market waiting for catalysts. The neutral technicals suggest range‑bound trading for now, with $4,600‑$4,620 as the immediate zone. Bulls need a hold above $4,600 to target $4,646, while bears need a breakdown below that level to accelerate selling. With high‑impact data later in the week, patience is key. Automate your trading with our AI Trading Bot and never miss a level – it trades 24/5 on XAUUSD with a proven edge.
Trading Gold (XAU/USD) involves significant risk of loss. This content is for informational purposes only and does not constitute financial advice. Always conduct your own research and trade responsibly.