Gold Live Analysis May 01 American Market: Short Setup at $4,625 Resistance
Gold is attempting a bounce in the American session on Friday, with the spot price testing the $4,625 resistance zone. After a volatile week, the precious metal is heading for a second consecutive weekly loss as higher-for-longer rate expectations weigh on sentiment. In this Gold live analysis May 01 American market, we break down the technical structure, key levels, and the best trading strategy for the hours ahead. Want to trade this setup automatically? Our AI Trading Bot runs 24/7 on XAU/USD with an 83%+ win rate and is already programmed to take advantage of these exact patterns.
Gold Market Overview
The New York session opened around $4,620 after a quiet Asian and European session. The US Dollar Index (DXY) remains under pressure following renewed yen intervention speculation, providing temporary support for gold. However, the broader fundamental picture remains bearish: inflation concerns and hawkish central bank rhetoric — including dissenters at the Federal Reserve pushing back against easing — keep the pressure on non-yielding assets. No high-impact USD data is expected today, so technical forces are in control. The market is currently digesting a counter-trend rally within a well-established downtrend.
Technical Analysis
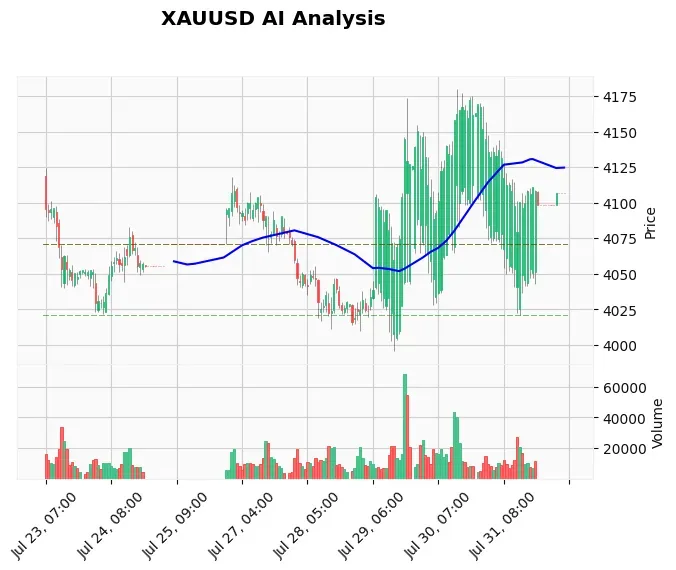
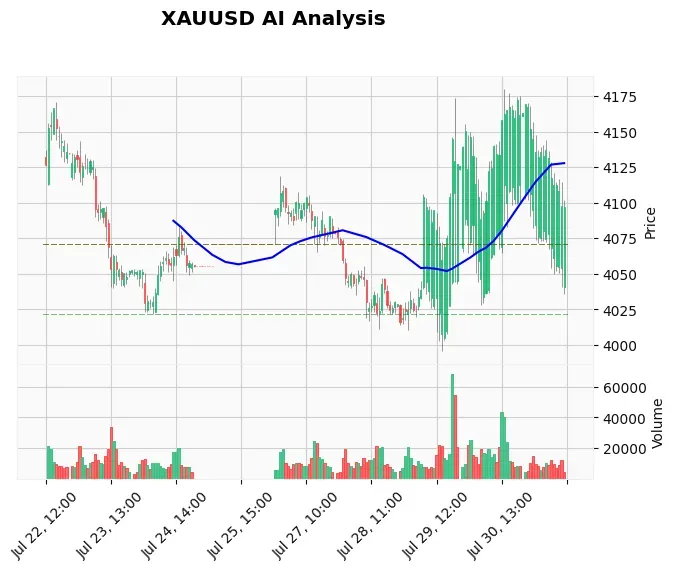
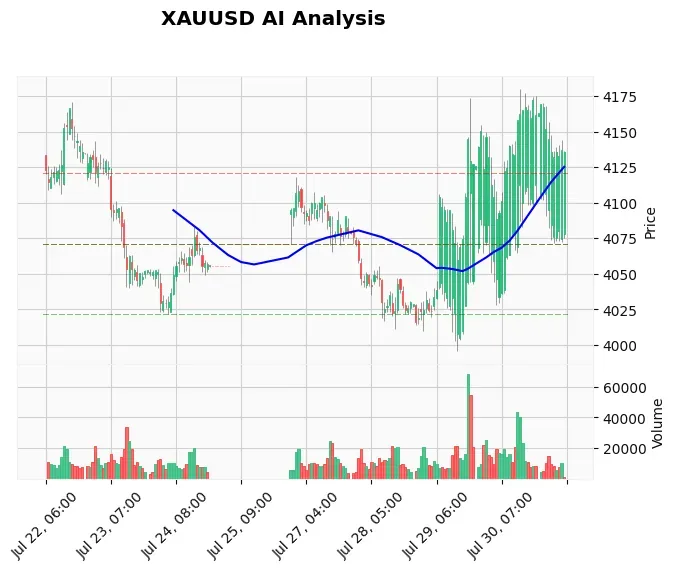
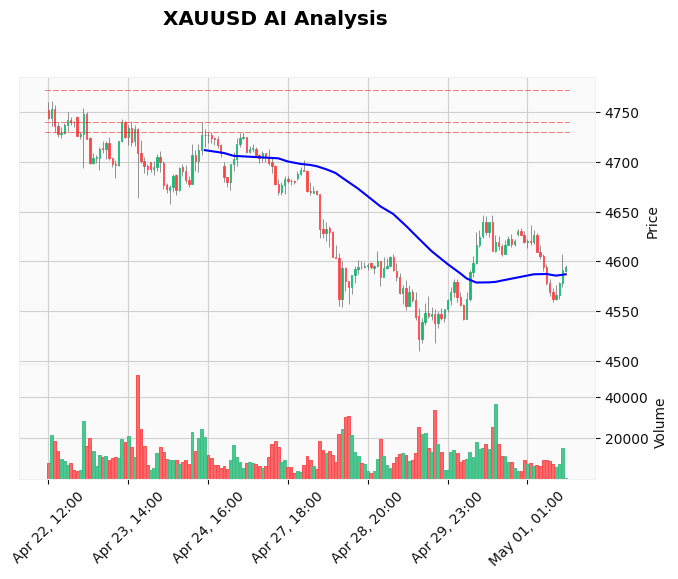
According to our TradingView webhook (updated 0.02 hours ago), the 60-minute chart shows a short-term trend with price at $4,625.82, down from the daily high of $4,628.82. Key moving averages: EMA 20 at $4,597.82, EMA 50 at $4,600.14, and EMA 200 at $4,655.60. The price is hovering between the 20 and 200 EMAs, indicating a potential squeeze. RSI stands at 59.63 — neutral but leaning slightly bullish on the short timeframe. MACD is still negative at -3.09 with the signal line at -1.81, and the two lines are converging, raising the chance of a bearish cross if the rally stalls. ATR is 19.22, meaning an average daily move of about $19, so a $4,600–$4,640 range is realistic for the session.
Resistance levels: immediate resistance at $4,646.73 (R1 from the webhook), followed by $4,658 (previous sell zone). Support: $4,510.31 (S1) and the psychological $4,500 round number. The daily chart remains bearish, with price below the 20, 50, and 200 EMAs. The current bounce looks like a counter-trend rally within a bearish structure — a textbook setup for a sell when price reaches a clear resistance. The chart is available on our technical analysis tools page for live tracking.
Fundamental Drivers
The dominant theme today is the hawkish Federal Reserve stance. Fed dissenters Kashkari and Hammack pushed back against any easing bias, reinforcing the "higher for longer" narrative. This keeps real yields elevated and cap gold's upside. Additionally, rising oil prices (driven by geopolitical tensions) fuel inflation worries, forcing central banks globally to stay aggressive. On the flip side, USD weakness from BOJ intervention talk is providing a short-term lift. The next major catalyst for gold will be next week's FOMC minutes and US jobs data. For traders who want to profit from news-driven moves, our News Trading Bot automatically trades high-impact events with a proven edge.
Devil's Advocate
What if the bounce continues? If gold closes above $4,646 on the hourly timeframe, the short-term outlook turns bullish. The next target would be $4,659 (EMA 200) and then the $4,700 zone. A breakout above $4,646 would invalidate the immediate bearish bias and suggest the counter-trend rally has more legs. Also, a weaker-than-expected US dollar due to aggressive BOJ intervention could push gold toward $4,750. Traders should watch the $4,646 level as the line in the sand for today.
Trading Strategy for This Session
Given the bearish daily trend and the resistance cluster near $4,625–$4,646, the most logical trade is a short from the $4,625–$4,640 zone. Entry: sell limit at $4,630–$4,640. Stop loss: above $4,655 (above the 200 EMA and R1). Take profit 1: $4,550 (previous support). Take profit 2: $4,510 (S1). Risk-reward ratio: approximately 1:2. This trade aligns with the daily bearish structure and uses the bounce as a better entry. If you prefer automated execution, check out the Price Action Pro EA — it specializes in SMC-based trades and is ideal for this counter-trend scenario.
Risk Management
Position size should be based on a 1% risk per trade — with a 20-pip stop (roughly $2 per ounce on XAU/USD), that means using 0.5 lots per $10,000 account. Keep an eye on the ATR (19.22) — the expected daily range suggests the stop could be hit quickly if volatility picks up. If the trade goes against you, do not add to a losing position. Wait for a daily close above $4,660 to consider reversing your bias. For passive risk management, consider Cloud Copy Trading to mirror professional risk-adjusted positions.
FAQ
What is the gold price today in the American session?
As of the New York afternoon, gold (XAU/USD) is trading around $4,625, up from the Asian low of $4,586. The session has seen a steady grind higher on USD weakness, but the daily trend remains bearish.
Is gold in a bullish or bearish trend right now?
The daily trend is bearish – price is below all three key moving averages (20, 50, 200) and RSI is below 50 on the daily chart. The hourly bounce is a counter-trend move, not a reversal. The short-term trend is still classified as 'short' by our algorithm.
What is the key resistance level to watch in the American session?
The immediate resistance is $4,646.73 (R1 from webhook data), followed by the hourly 200 EMA at $4,655.60. A break above $4,660 would shift the short-term bias to bullish.
What support levels matter if gold reverses from $4,625?
The first support is $4,586 (today's low), then $4,560 (previous session low), and ultimately $4,510 (S1). If $4,500 breaks, the next major support is $4,450.
How many pips movement can we expect today?
Based on an ATR of 19.22 (which equates to roughly $19 per ounce or 190 pips for standard gold contracts), the average daily range is about $38. With the current range from the low ($4,586) to current ($4,625) at $39, we are already near the average. Further expansion could bring $4,640 or a drop to $4,560.
Conclusion
To wrap up this Gold live analysis for the May 01 American market, the setup remains short-biased with a clear entry zone at $4,625–$4,640 and a stop above $4,655. The daily bearish structure and lack of bullish catalysts suggest this bounce is an opportunity to sell, not a reason to go long. Keep your risk tight and watch for a rejection candle at resistance. For traders who prefer a fully hands-off approach, our AI Trading Bot is already scanning these levels and executing short entries with a tested strategy. Join thousands of traders who let the algorithms do the heavy lifting while they sleep.
Trading Gold (XAU/USD) involves significant risk of loss. This content is for informational purposes only and does not constitute financial advice. Always conduct your own research and trade responsibly.