How to Use Moving Averages in Gold Trading: A Complete Guide
\n\nEvery gold trader has faced the frustration of buying at the top or selling at the bottom. Price noise and sudden spikes make it nearly impossible to see the real trend – unless you have the right tool. Moving averages strip away market randomness and show you the underlying direction. Whether you trade XAUUSD on the 5‑minute chart or the daily timeframe, learning how to use moving averages in Gold trading can transform your entries and exits. In this guide, we’ll walk through the most effective ways to apply moving averages to XAUUSD, from trend identification to crossover signals. If you prefer to trade fully automated, our AI Trading Bot combines moving averages with advanced machine learning to generate high‑probability setups around the clock.
\n\nWhat Are Moving Averages?
\n\nA moving average (MA) is a lagging indicator that calculates the average price of an asset over a specific number of periods. As new price data arrives, the oldest data point drops off, keeping the line “moving.” The two most common types are the Simple Moving Average (SMA) and the Exponential Moving Average (EMA).
\n\nThe SMA gives equal weight to every period in the calculation. For example, a 50‑day SMA sums the closing prices of the last 50 days and divides by 50. The EMA, on the other hand, places more weight on recent prices, making it more responsive to current market action. Gold traders often prefer EMAs for shorter timeframes (like 1‑hour or 4‑hour) because gold can react quickly to news, and a faster‑reacting line helps you stay ahead of the move. On daily and weekly charts, many traders stick with SMAs for their stability and proven track record.
\n\nWhy Moving Averages Matter for Gold Traders
\n\nXAUUSD is heavily influenced by macroeconomic forces, central bank policies, and geopolitical events. These factors create trends that can last for weeks or months. Moving averages help you in three critical ways:
\n\n- \n
- Trend identification: A rising moving average indicates an uptrend; a falling one signals a downtrend. When gold trades above the 200‑day MA, the long‑term trend is bullish. Below it, bearish. \n
- Dynamic support and resistance: In trending markets, moving averages act like magnets. During a gold rally, pullbacks often stop at the 20‑day EMA. In a sell‑off, bounces frequently stall at the 50‑day MA. \n
- Crossover signals: When a faster MA crosses above a slower MA, it generates a bullish signal (golden cross). The opposite is a death cross (bearish). These are among the most followed signals in gold trading. \n
By filtering out short‑term noise, moving averages let you focus on the true market direction – exactly what you need when trading a volatile asset like gold.
\n\nHow to Use Moving Averages Step by Step
\n\nChoose the Right Timeframe and Settings
\n\nFor gold, the most popular moving average periods are:
\n- 20 EMA (short‑term trend, used on 1‑hour to daily charts)
\n- 50 SMA/EMA (intermediate trend, supports during pullbacks)
\n- 200 SMA (long‑term trend, major support/resistance on daily and weekly)
Add Moving Averages to Your Chart (MT4/MT5)
\n\n1. Open the XAUUSD chart.
\n2. Click Insert → Indicators → Trend → Moving Average.
\n3. Set the period (20, 50, or 200), choose EMA or SMA, and select “Close” as the price.
\n4. Click OK. Repeat for each MA you want to plot.
Interpret the Slope and Position
\n\nIf the 20 EMA slopes up and price stays above it, the short‑term trend is bullish. If price dips to the 20 EMA and bounces, that’s a potential entry. When the 100‑day SMA (optional) crosses above the 200‑day SMA, it’s a golden cross – a powerful long‑term bullish signal. The opposite death cross warns of a potential bear market.
\n\nCombine with Price Action
\n\nNever rely on moving averages alone. Look for candlestick patterns (hammer, engulfing) at the MA level before entering. For example, if gold is trending up and pulls back to the 50‑day SMA, wait for a bullish rejection candle on the daily chart before going long. This confirmation improves your win rate dramatically.
\n\nFor traders who want to automate these strategies, the Price Action Pro EA uses moving averages and order‑block analysis to precisely time entries on XAUUSD.
\n\nCommon Mistakes Gold Traders Make with Moving Averages
\n\n- \n
- Using too many MAs: Cluttering your chart with five or six moving averages creates noise and confusion. Stick to two or three carefully chosen periods. \n
- Ignoring the trend context: A golden cross is useless in a sideways market. Always check the broader trend first (e.g., 200‑day MA slope). \n
- Chasing crossover signals late: By the time a crossover appears, price may have already moved significantly. Combine with momentum oscillators like RSI to avoid late entries. \n
- Neglecting stop losses: Moving averages are dynamic support/resistance but they can break. Always set a stop below the most recent swing low or the MA itself. \n
Avoiding these pitfalls will save you from expensive drawdowns. To build a solid foundation, consider enrolling in our Gold trading courses where we cover moving average strategies in depth with live chart examples.
\n\nReal Example on XAUUSD Chart
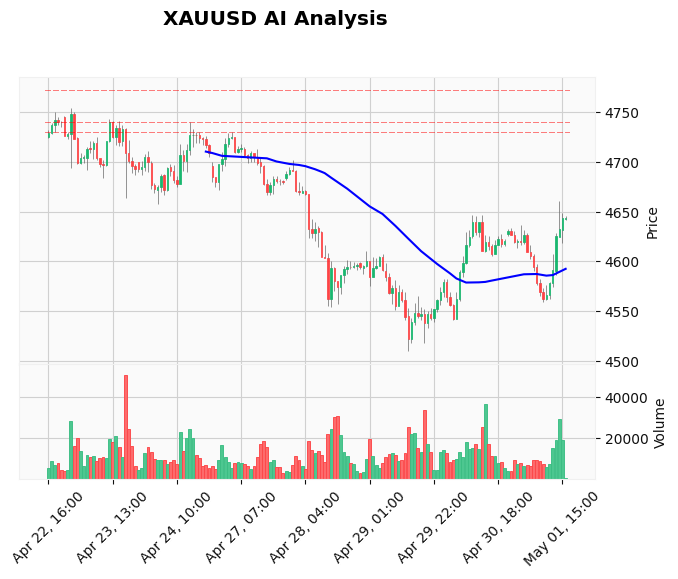
\n\nLet’s look at a typical gold rally scenario from late April 2026. XAUUSD was trading around $2,250 in late March, then started climbing. The 20‑day EMA crossed above the 50‑day SMA on April 12, generating a bullish crossover. Price hugged the 20‑day EMA for the next two weeks, pulling back only once on April 22 when it touched the 50‑day SMA and bounced sharply. That bounce was a textbook long entry: price above both MAs, both sloping up, and a bullish engulfing candle at the 50‑day SMA. The rally continued to $2,350 by May 1 – a $100 gain.
\n\nGold traders who used moving averages to stay long through this move captured a clean trend. Those who ignored the MAs and tried to fade the rally were stopped out repeatedly. This example shows why mastering moving averages is essential for consistent XAUUSD trading. For real‑time signals, our live Gold trading signals incorporate moving average analysis to deliver actionable entry alerts every day.
\n\nFAQ – Moving Averages in Gold Trading
\n\nWhat is the best moving average for gold?
\nThere is no single “best” MA, but the 20‑day EMA (short‑term), 50‑day SMA (intermediate), and 200‑day SMA (long‑term) are the most widely used. For scalping, a 10‑day EMA on the 15‑minute chart works well. Experiment with settings that suit your trading style.
\n\nHow do you trade the golden cross on XAUUSD?
\nThe golden cross occurs when the 50‑day SMA crosses above the 200‑day SMA. Wait for the cross to close above the 200‑day SMA. Then look for a pullback to the 50‑day SMA that holds and shows bullish price action. Enter long with a stop below the 200‑day SMA. Target the next major resistance level.
\n\nWhy do gold traders use the 200‑day moving average?
\nThe 200‑day SMA represents the long‑term trend. Central banks and institutional traders watch it closely. When gold is above the 200‑day MA, the market is considered in a secular bull trend. A break below often signals a major shift in sentiment and can trigger aggressive selling.
\n\nCan moving averages be used for scalping gold?
\nYes, scalpers often use a combination of a 5‑day EMA and a 20‑day EMA on the 5‑minute or 1‑minute chart. The 5‑day EMA crossing above the 20‑day EMA provides quick entry signals during volatile news periods. However, moving averages are lagging by nature, so scalpers should confirm with volume or RSI.
\n\nConclusion
\n\nMoving averages are the backbone of any reliable gold trading system. They reveal the trend, offer dynamic support and resistance, and generate clear buy/sell signals through crossovers. By using the 20, 50, and 200‑day MAs on your XAUUSD chart, you’ll eliminate guesswork and trade with a structured plan. The key is to practice – start on a demo account, apply the step‑by‑step method above, and refine your approach. And if you want to take your gold trading to the next level, consider using our AI Trading Bot which executes moving‑average‑based strategies automatically with a proven track record. Master these tools, and you’ll trade gold with the confidence of a professional.
\n\nTrading Gold (XAU/USD) involves significant risk of loss. This content is for informational purposes only and does not constitute financial advice. Always conduct your own research and trade responsibly.