Gold Price Forecast: Week of May 02-08, 2026
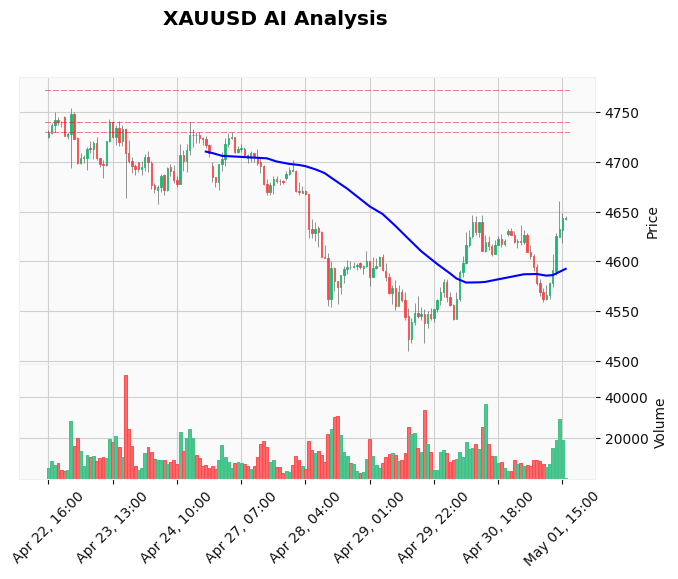
Gold ended last week at $4,616.19, down 1.36% from its open of $4,679.86, but well off the weekly low of $4,510.31. The metal staged a powerful intra-week recovery, bouncing over $100 from the lows, and now traders are asking: will the rally continue this week or is a retest of support ahead? In this week's forecast, we break down the technical structure, the fundamental drivers, and the key levels that will define the next move. For those looking to automate their Gold trades, our AI Trading Bot provides 24/7 coverage with an 83% win rate.
Last Week in Review
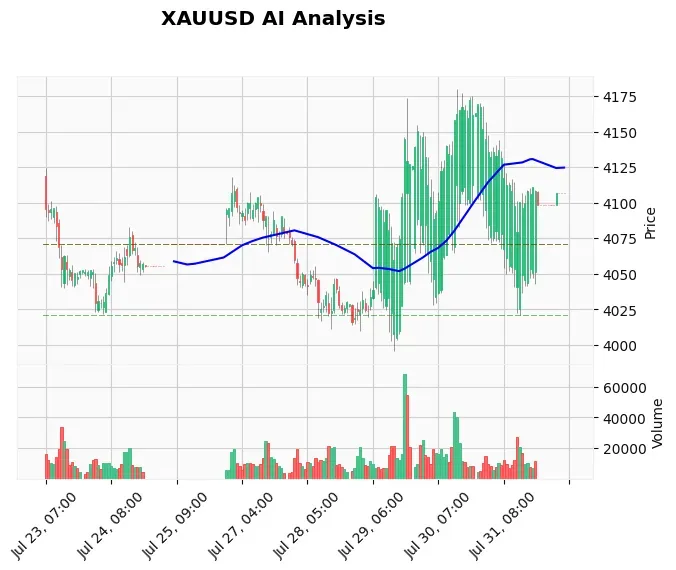
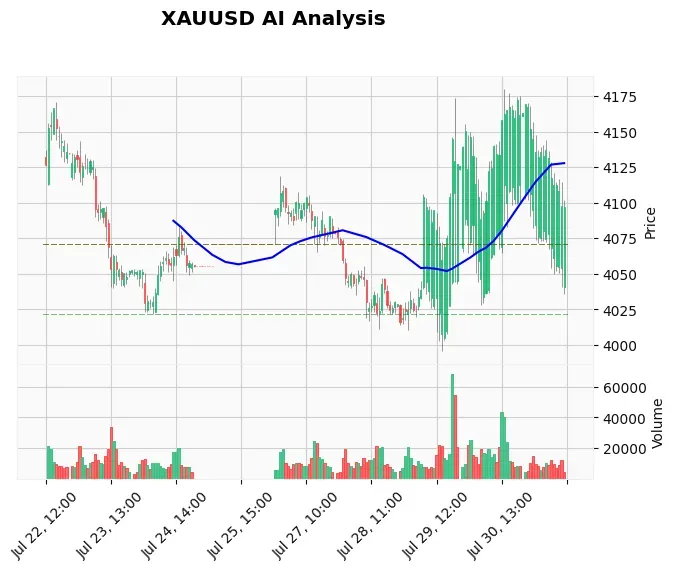
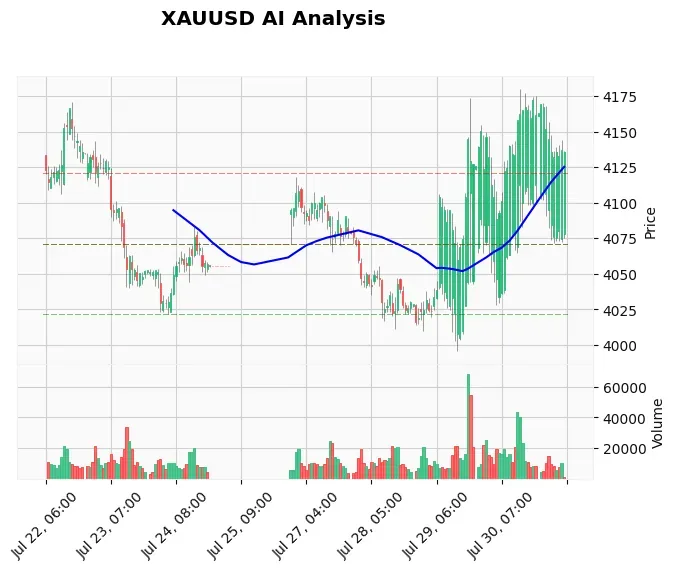
Gold opened the week at $4,679.86 and immediately came under pressure as the US Dollar strengthened on renewed tariff threats from Washington. The greenback's rebound from two-week lows, combined with profit-taking after the prior week's rally, pushed XAU/USD to a low of $4,510.31 by mid-week. However, a sharp reversal on Thursday and Friday, fueled by safe-haven flows related to escalating Middle East tensions and an unexpected intervention by the Bank of Japan that crushed the dollar, lifted Gold back above $4,600. The weekly close at $4,616.19 left a long lower wick on the weekly candle, a classic bullish reversal pattern. The range was $219.77, well above the ATR of $119.92, indicating extreme volatility. Key takeaways: the $4,500 area held as strong support, but resistance at the 20-week EMA ($4,693) and the psychological $4,700 remains intact. The AI Analysis Log from May 1 noted that while the daily chart is bearish, the M15 timeframe shows surging momentum, suggesting a short-term bullish reversal may be underway. No high-impact US economic events were scheduled for the week, leaving price action driven primarily by geopolitics and FX dynamics.
Weekly Technical Outlook
The weekly technical picture presents a market in transition. The RSI sits at 42.87, just below the 50 neutral mark, confirming that momentum is still tilted slightly to the downside but not oversold. The EMA structure shows bearish alignment: price is below both the 20 EMA ($4,693.30) and the 50 EMA ($4,745.73), but well above the 200 EMA ($4,331.38), which serves as major long-term support. The MACD histogram prints -44.24 with the signal line at -33.19, both negative but showing signs of flattening. A bullish cross would require the MACD line to move above the signal line, which could happen if this week's rally continues. The ATR of $119.92 means we should expect daily swings of roughly $120, making wide stops and targets necessary.
Key levels from our TradingView webhook data: Support at $4,099.02 (S1) and $4,402.72 (S2); Resistance at $4,889.44 (R1) and $5,419.15 (R2). Given the weekly close near $4,616, the immediate focus is on S2 support at $4,402, which aligns with the recent low area, and R1 resistance at $4,889, a zone that has not been tested since early March. Scenarios to watch:
- Bullish scenario: A sustained move above $4,700 (20-week EMA) opens the door to a test of $4,889. A close above that would target the $5,000 psychological level and then $5,419.
- Bearish scenario: A rejection from current levels and a break below $4,500 would likely drive price to retest $4,402 (S2). If that fails, the next major support is $4,099.
- Neutral scenario: Consolidation between $4,550 and $4,700 with no clear breakout, as traders wait for the next catalyst.
Fundamental Outlook
The fundamental backdrop for Gold remains mixed but leans bullish in the short term. The dominant themes are geopolitical uncertainty, central bank divergence, and inflation fears. US tariff chatter continues to weigh on risk appetite, supporting safe-haven buying. The Bank of Japan's intervention to weaken the US Dollar has added fuel to Gold's rally, as a weaker dollar makes XAU/USD more attractive. At the same time, the Federal Reserve's higher-for-longer rate narrative remains a medium-term headwind. Recent Fed speakers have shown internal division, with some calling for patience and others warning about inflation persistence. This uncertainty prevents a decisive breakout. On the positive side, physical Gold demand remains robust from central banks, particularly in Asia. The lack of high-impact US economic data this week means gold will likely take its cue from equity markets, USD moves, and any geopolitical headlines. The overall AI sentiment assessment is bullish near-term but medium-term bearish – a tension that creates both opportunity and risk for swing traders.
Economic Calendar (USD High-Impact Events)
| Date | Event | Previous | Forecast |
|---|---|---|---|
| No high-impact USD events scheduled for the week of May 02-08, 2026. Market focus will be on geopolitical developments and central bank commentary. | |||
With an empty economic calendar, traders should watch for unexpected headlines. For news-driven moves, the News Trading Bot can automatically execute trades around high-impact releases across all asset classes.
Gold Trading Strategy This Week
Our base case is a neutral-to-bullish bias for the week. The bounce from $4,510 was impulsive, and the positioning suggests buyers are stepping in on dips. However, the trend on higher timeframes is still bearish until price reclaims $4,700. Therefore, we recommend a buy-on-dip approach with careful risk management.
Swing Trade Setup:
Entry zone: $4,550 – $4,580 (if price pulls back)
Stop loss: $4,480 (below the week's low and S2 level)
Take profit 1: $4,700
Take profit 2: $4,850
Day Trade Setup (if short-term momentum continues):
Buy on break above $4,650 with a target of $4,700 and stop at $4,590.
If price breaks firmly below $4,500, the bias flips bearish and a short trade targeting $4,400 becomes viable. For traders who prefer a hands-off approach, our Price Action Pro EA uses SMC-based logic to identify high-probability entries and can run 24/7 on a VPS.
Risks to Watch
The biggest risk this week is a sudden strengthening of the US Dollar if tariff threats de-escalate or if the Fed delivers a hawkish surprise. Additionally, any ceasefire breakthrough in the Middle East could remove the safe-haven bid and send Gold lower. On the flip side, an escalation of the Japan intervention or a sharp equity selloff could drive gold above $4,700 quickly. The key invalidation level for our bullish bias is a daily close below $4,500. If that happens, the path to $4,400 or lower opens.
Frequently Asked Questions
Will gold go up next week?
Based on current technical and fundamental analysis, gold has a neutral-to-bullish bias for the week of May 2-8, 2026. The recovery from $4,510 suggests strong buying interest, but resistance at $4,700 may cap gains. A break above that level would signal a bullish move toward $4,889.
What is the gold support and resistance for this week?
Key support levels are $4,402 and $4,500 (psychological). Major resistance lies at $4,700 (20-week EMA) and $4,889 (R1 from our webhook analysis). A weekly close above $4,700 would target $5,000.
Is gold a buy or sell this week?
We recommend a buy-on-dip strategy with entry near $4,550-$4,580 and a stop below $4,480. Avoid chasing breakouts above $4,700 as false breakouts are common in this environment. For conservative traders, waiting for a retest of $4,500 with a bullish reversal candle is ideal.
How does the US Dollar impact gold this week?
The US Dollar Index (DXY) rebounded last week but faces new headwinds from the Bank of Japan's intervention. A weaker dollar supports gold as it makes XAU cheaper for non-USD buyers. Watch for DXY moves around 100.50 – a break below that level would be strongly bullish for gold.
What are the best trading strategies for gold this week?
Swing traders should focus on the $4,550-$4,580 buy zone with a risk-reward ratio of at least 1:2. Day traders can trade momentum on breaks above $4,650 or reversals from $4,700. For automated execution, consider using our AI Trading Bot which trades XAUUSD around the clock with proven results.
Conclusion
Gold closed last week with a bullish reversal candle and enters May with a cautiously optimistic tone. The battle between geopolitically driven safe-haven demand and the headwind of high US interest rates will define the week. With no high-impact data, technical levels become paramount. The $4,500 support held, and now bulls need to conquer $4,700 to shift the medium-term trend higher. Our recommended strategy is to buy dips near $4,550 with a stop below $4,480, targeting $4,700 and $4,850. Remember, volatility is elevated, so position size accordingly. For traders who want to automate this plan, our AI Trading Bot can execute your strategy 24/7. Trade safely, and we'll see you next week for the next gold forecast.
Trading Gold (XAU/USD) involves significant risk of loss. This content is for informational purposes only and does not constitute financial advice. Always conduct your own research and trade responsibly.