XAUUSD US Session Forecast April 17: Can Bulls Clear $4,890?
The XAUUSD US session forecast April 17 centers on a critical test of strength. Gold bulls have pushed the price to $4,880, flirting with the day's high at $4,889.44, but the rally is hitting a wall of technical and fundamental resistance just as the volatile American session gets underway. While the underlying trend remains powerfully bullish, an overbought RSI and fading safe-haven demand threaten a near-term correction. This analysis provides the crucial levels, drivers, and a precise trading strategy for the New York hours. Want to trade this high-stakes environment without hesitation? Our AI Trading Bot executes these tactical setups on XAU/USD 24/7 with an 83% win rate.
Gold Market Overview: Momentum Meets Headwinds
Gold enters the US session with impressive momentum but mixed signals. The price action shows buyers are firmly in control on a higher timeframe, having broken above all key daily moving averages. However, the rally is now pausing just below the $4,890 high. The fundamental picture is providing the friction: growing optimism around potential US-Iran peace talks is reducing the immediate geopolitical premium in gold, creating a "risk-on" undercurrent that typically caps bullion's appeal. Concurrently, the US Dollar remains on the back foot, which is supportive, but a neutral-to-hawkish Fed stance (no rate cuts) continues to act as a ceiling for runaway rallies. The battle between technical momentum and fundamental caution defines this session.
Technical Analysis: Overbought at Resistance
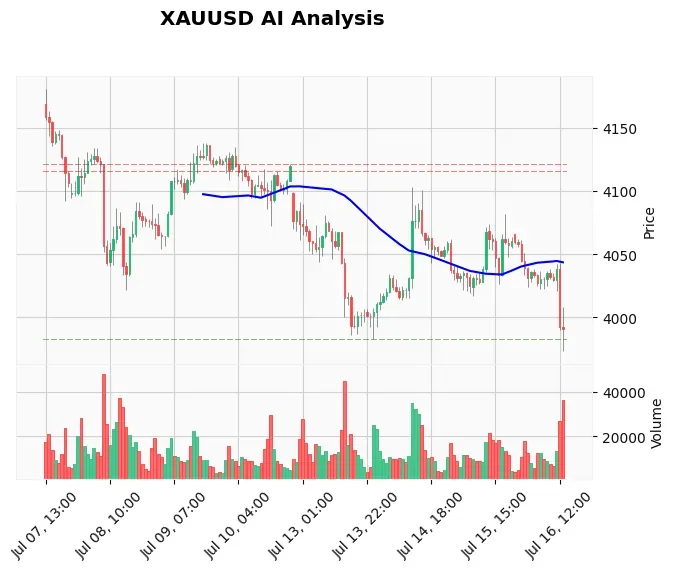
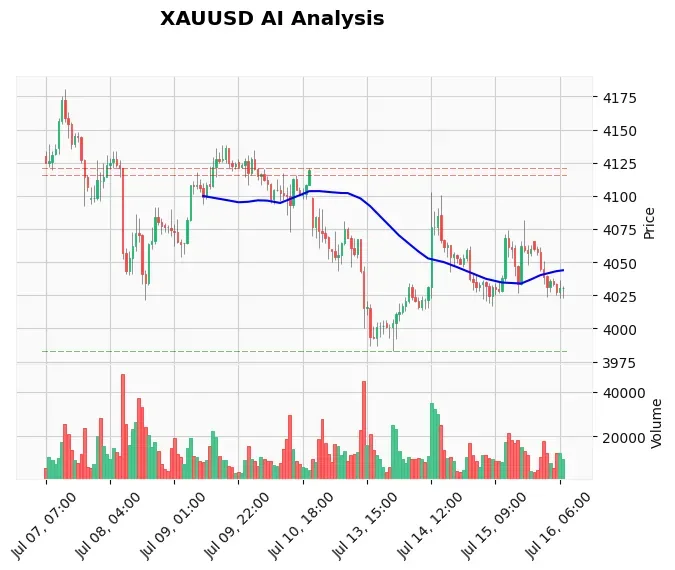
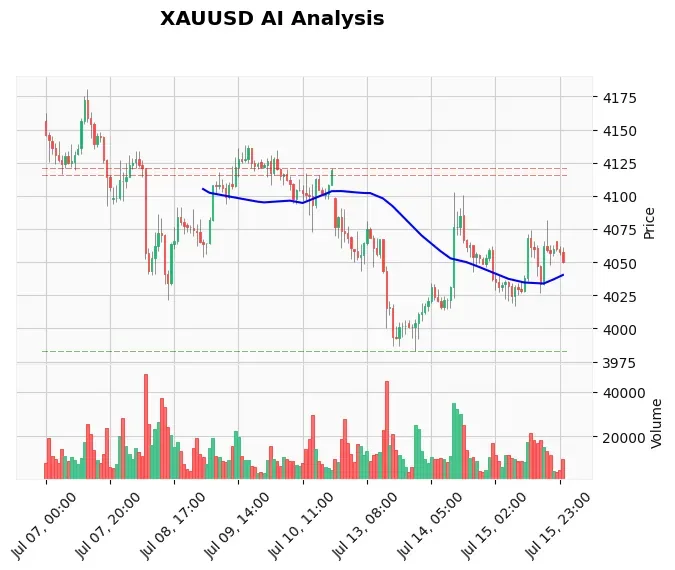
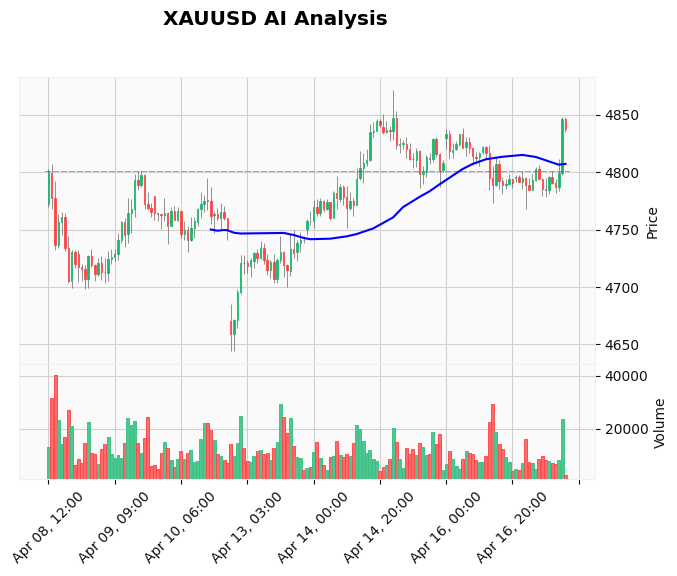
The technical structure is bullish but stretched. Price is trading at $4,880, well above the critical EMA cluster (20-day at $4,807, 50-day at $4,803, and 200-day at $4,761). This alignment confirms the primary uptrend. However, the RSI reading of 74.53 on the hourly chart signals overbought conditions, warning that the buying power may be exhausted in the short term. The MACD histogram is positive at 7.15, but momentum is decelerating. The key levels are clear: immediate resistance sits at $4,890.44 (today's high), followed by the psychological $4,900 zone. On the downside, initial support is at $4,838, with stronger buying interest expected near the $4,815 - $4,820 area, which aligns with prior consolidation and the rising EMA support. The Average True Range (ATR) of 20.73 confirms volatility is elevated, meaning moves can be swift.
Fundamental Drivers: Peace Talks vs. Dollar Weakness
Two opposing forces are at play. The headwind is the market's growing hope for a diplomatic solution between the US and Iran, which eases safe-haven demand. This is the primary reason gold is struggling to gather fresh bids despite its bullish technical posture. On the supportive side, the US Dollar is poised for its second weekly decline, making dollar-denominated gold cheaper for foreign buyers. There are no high-impact US economic data releases scheduled for the remainder of the day, meaning price action will be driven by technical flows, broader risk sentiment, and any unexpected headlines on the geopolitical front. For traders who want to capitalize on sudden news-driven moves, our News Trading Bot is engineered to react to high-impact events in milliseconds.
Devil's Advocate: The Case for a Pullback
While the trend is up, the smart money is aware of the risks. The most compelling bearish argument is the overbought RSI coinciding with a major resistance test. A rejection from the $4,890 area could trigger a healthy correction to relieve overextension. The target for such a move would be the $4,820-$4,830 support confluence. Fundamentally, if peace talk optimism solidifies or yields tick higher, it could provide the catalyst for profit-taking. The bullish scenario would be invalidated by a daily close back below the $4,800-$4,810 support zone, which would signal a failure of the recent breakout and potentially open the door for a deeper retracement.
Trading Strategy for the US Session
Given the overbought conditions at resistance, the optimal strategy is to wait for either a confirmed breakout or a pullback to a higher low. Aggressive Breakout Long: A sustained 1-hour close above $4,890.44 could signal renewed momentum. An entry on a retest of this level as support, with a stop loss below $4,870, targets a move toward $4,920 - $4,930. Patient Pullback Long: A more conservative approach is to wait for a dip into the $4,820 - $4,830 support zone. An entry in this area with a stop below $4,810 offers a favorable risk/reward, targeting a return to the $4,880-$4,890 highs. For executing this type of precise price action strategy automatically, consider our Price Action Pro EA, which is built to identify and trade these SMC-based setups.
Risk Management
Volatility is high (ATR 20+), so position sizing is critical. Risk no more than 1-2% of your account on any single Gold trade. For both strategies outlined, the initial risk (stop loss to entry) should not exceed 0.5% of your capital. If the market moves in your favor, consider moving your stop loss to breakeven once price has moved 1x ATR ($20) in your direction to lock in a risk-free trade. Always have a pre-defined exit plan for both profit and loss before entering.
Frequently Asked Questions (FAQ)
Q: Is gold overbought right now on April 17?
A: Yes, on the hourly timeframe, the RSI reading of 74.53 indicates overbought conditions. This suggests the rally may be due for a pause or pullback, especially as it tests the $4,890 resistance level.
Q: What is the key resistance for XAUUSD today?
A: The key resistance to watch is the intraday high at $4,889.44. A decisive break and close above this level could open the path toward $4,920. The $4,900 psychological level is also a major barrier.
Q: Why is gold not rallying despite dollar weakness?
A: The primary offsetting factor is optimism around US-Iran peace talks, which reduces gold's safe-haven appeal. This fundamental headwind is capping the upside that would typically come from a weaker US Dollar.
Q: What is a good support level to buy gold on a dip?
A: For a potential long entry on a pullback, the $4,820 - $4,830 zone is critical. It aligns with previous resistance-turned-support and is above the key daily moving averages, keeping the bullish structure intact.
Conclusion
The XAUUSD US session forecast April 17 hinges on the battle at $4,890. The bulls have the trend, but the bears have overbought momentum and fading geopolitical fear. The prudent course is to avoid chasing the rally at these highs. Instead, wait for the market to show its next move—either with a confirmed breakout above resistance or a constructive pullback to a higher low near $4,820. The outcome will set the tone for the rest of the week. Managing risk in this elevated volatility environment is paramount. For traders seeking a disciplined, emotion-free approach to capturing these Gold swings, our best-selling Gold trading bot provides a systematic edge, turning complex market analysis into consistent execution.
RISK DISCLAIMER
Trading Gold (XAU/USD) involves significant risk of loss. This content is for informational purposes only and does not constitute financial advice. Always conduct your own research and trade responsibly.