Gold price today June 01 2026 Europe: Bears Retest $4,500 – Next Leg to $4,460?
The Gold price today June 01 2026 Europe session opens with XAUUSD facing renewed selling pressure, hovering just above the psychological $4,500 mark. After last week’s sharp rejection from the $4,600 area, bears are testing the lower boundary of the recent range, and with key US economic data just hours away, the next leg down to $4,460 looks increasingly plausible. Traders watching this retest can automate their approach with our AI Trading Bot, which has been built to exploit exactly these precision sell setups on XAU/USD.
Gold Market Overview
European morning trade on Monday is defined by a firm US dollar, hawkish Fed rhetoric, and diminishing safe-haven demand. The greenback continues to draw bids ahead of the ISM Manufacturing PMI (forecast 53.3 vs. 52.7 prior), due in less than seven hours, which could reinforce the higher-for-longer rate narrative. Powell’s weekend remarks warning against politicizing the Fed further cemented expectations that rate cuts remain distant, while progress in US-Iran talks has eased geopolitical risk premiums that previously supported gold.
With no major tier-one data releases before ISM, the market’s focus is squarely on the dollar’s momentum and whether it triggers a decisive break of $4,500. So far, gold has slipped from an early high of $4,510 to test session lows near $4,492, and the tone in the London open is decidedly defensive.
Technical Analysis
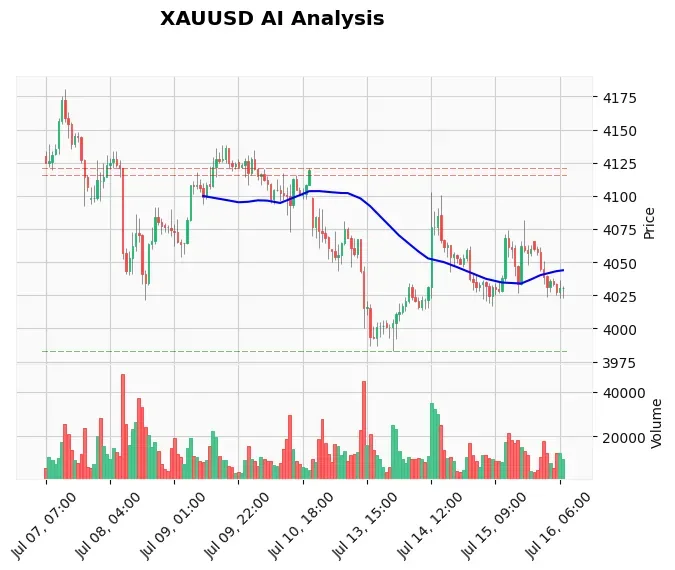
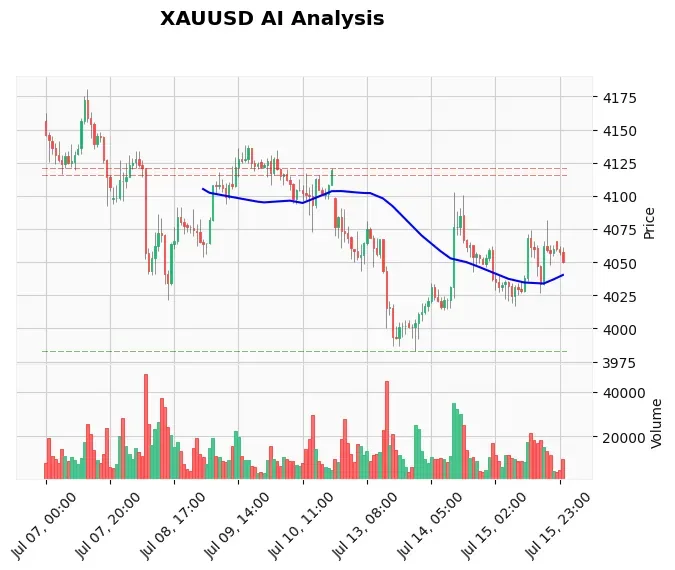
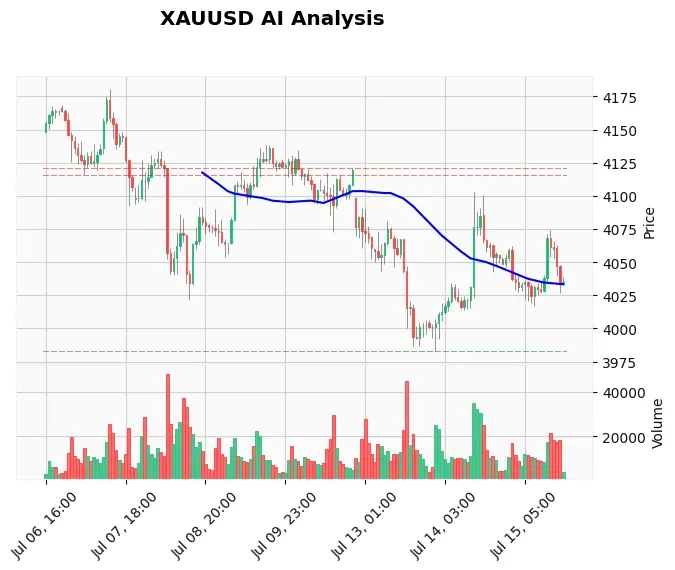
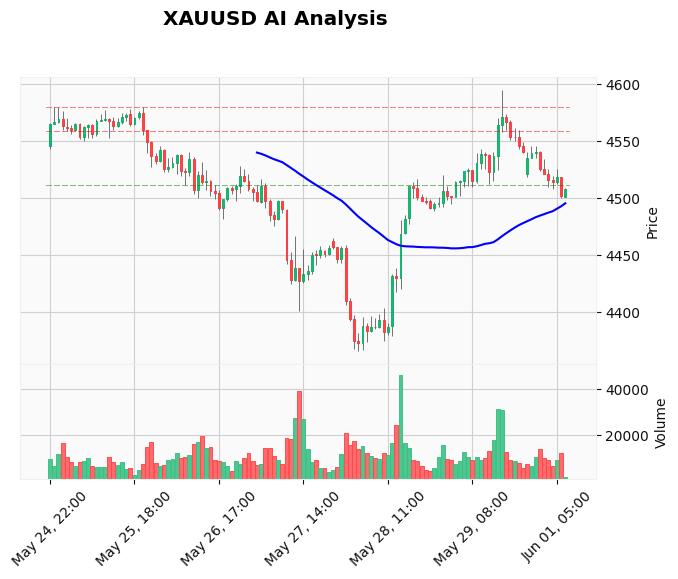
XAUUSD’s hourly chart paints a bearish picture despite the overall daily trend flirting with neutrality. The series of lower highs since the $4,600 peak is intact, and the 20 EMA ($4,523) has crossed below the 200 EMA ($4,521) while remaining above the 50 EMA ($4,510) – a mixed but ultimately bearish configuration that suggests fading upside momentum. The RSI stands at 40.72, deep in neutral territory and leaning toward oversold, but the MACD histogram remains negative, with the MACD line (0.04) far below its signal line (7.39), underscoring sustained downward pressure.
Our real-time TradingView webhook confirms an ATR of $16.94, indicating modest intraday swings. On the downside, support sits at $4,500 (psychological level) and $4,480 (last week’s swing low). Should that give way, Fibonacci extensions point to $4,460 as the next magnet. Resistance is clustered at $4,535–$4,540, which has acted as a lid on every bounce since Friday, with stronger supply at $4,580–$4,630.
CHART NOTE: The 1‑hour chart shows a clear descending structure with price trading below all major EMAs, reinforcing the intraday sell bias.
Fundamental Drivers
Today’s calendar is dominated by the ISM Manufacturing PMI at 14:00 UTC. A beat on the 53.3 forecast would likely inject fresh dollar strength and accelerate gold’s decline toward $4,460. Earlier rhetoric from Fed Chair Powell – cautioning that political interference could undermine public trust – adds a hawkish undercurrent, while easing tension surrounding Iran reduces gold’s safe-haven allure. The broader data week, which also includes ADP jobs and ISM Services, sets a USD‑supportive backdrop that could keep gold on the defensive unless numbers seriously miss.
For traders who want to capitalize on news-driven volatility without sitting at the screen, the News Trading Bot automatically enters XAUUSD around high-impact events like the ISM release, using algorithmic logic to capture momentum moves.
Devil’s Advocate
The primary risk to the bearish case is a disappointing ISM print, which would undermine the dollar and spark a short squeeze back toward $4,535–$4,540. If price reclaims $4,540 on a daily close, the bearish structure breaks, and the pending sell order at $4,535 would be in jeopardy. A close above $4,565 would invalidate the entire short setup and shift the bias back toward the $4,600 resistance zone.
Trading Strategy for This Session
Our AI Analysis Log maintains a SELL LIMIT order at $4,535, placing the entry just below the intraday resistance cluster. This counter‑trendline area aligns perfectly with the bearish daily structure. The recommended parameters are:
- Entry: Sell limit at $4,535
- Stop Loss: $4,565 (above recent swing high and supply zone)
- Take Profit 1: $4,490
- Take Profit 2: $4,460
- Final Target: $4,420
This setup offers a risk‑reward profile exceeding 1:2.5, and the entry zone coincides with the 20 EMA on the hourly chart. To execute this strategy with discipline and zero emotion, many traders rely on our Price Action Pro EA, which can automatically place the pending order and manage risk once the level is hit.
Risk Management
With an ATR of $16.94, stops below $4,565 should be set with a buffer to absorb normal intraday noise. If entering manually, sizing the position so that a full stop‑out represents no more than 1‑2% of account equity is essential. Avoid chasing a break of $4,500; wait for a retest of that level as resistance before committing more capital. Should the ISM data create a violent spike, step aside until volatility normalizes.
FAQ
Q: Why is gold dropping today in the European session?
A: Gold is slipping because the US dollar is firming ahead of the ISM Manufacturing PMI, and hawkish Fed comments have dampened rate‑cut expectations. Progress in US‑Iran talks also reduces demand for safe‑haven assets like XAU/USD.
Q: What are the key support levels for XAUUSD today?
A: The immediate support is $4,500, a psychological round number. A break below could quickly target $4,480, then $4,460. The wider daily structure shows deeper support at $4,453 and eventually $4,366 if the sell‑off accelerates.
Q: How does the ISM Manufacturing PMI affect gold prices?
A: A stronger ISM reading (above 53.3) typically boosts the US dollar because it points to economic resilience, making gold more expensive for foreign buyers. A miss, however, can weaken the dollar and push gold back toward $4,540.
Q: Is it wise to sell gold now, or should I wait for a pullback?
A: Selling directly at market may carry elevated risk near the $4,500 floor. The recommended approach is to set a limit order at $4,535, which gives a safer entry after a minor bounce into resistance. This aligns the trade with the dominant bearish trend while offering a favourable risk‑reward ratio.
Conclusion
Gold’s inability to hold above $4,535 and the persistent pressure on $4,500 speak to a market firmly controlled by sellers. The impending ISM release injects fresh catalysts, but the technical structure already points lower. As long as XAUUSD remains below $4,535, the path of least resistance is toward $4,460 and potentially $4,420. For traders looking to profit from this bearish bias without constant monitoring, the AI Trading Bot can execute the exact sell‑limit strategy 24/7 with proven consistency.
Risk Disclaimer: Trading Gold (XAU/USD) involves significant risk of loss. This content is for informational purposes only and does not constitute financial advice. Always conduct your own research and trade responsibly.