XAUUSD US Session Forecast June 01: Why Gold Could Bounce Despite the Bearish Breakdown
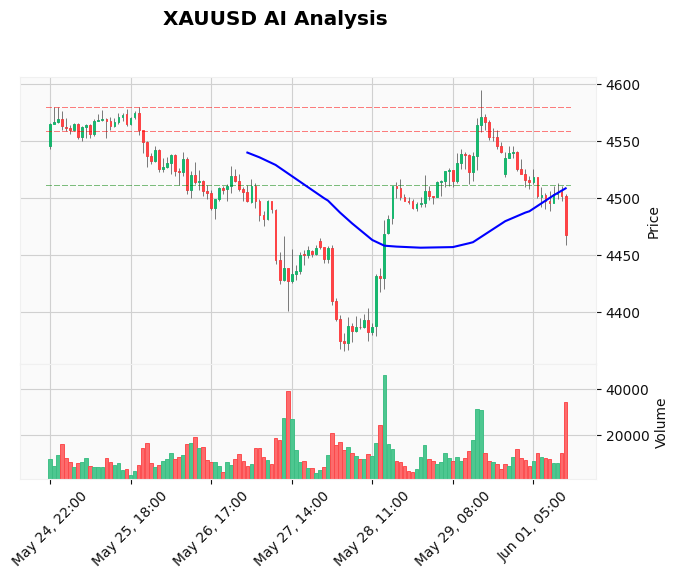
Gold is making headlines for all the wrong reasons this Monday, and the US session is shaping up to be a pivotal moment. The XAUUSD US session forecast June 01 centers on a brutal breakdown below the $4,500 handle, a level that held as support just hours ago. As of the London close, XAU/USD is trading around $4,450, having printed an intraday low of $4,448.86, the lowest point in over a week. The sell-off is being fueled by a rampant US Dollar and the market’s anticipation of today’s high-impact ISM Manufacturing PMI data, due in less than fifteen minutes. The question on every trader’s mind: after such a sharp decline, is a short squeeze imminent, or will the bears extend this move to $4,460 and beyond? For those who’d rather let algorithms handle the split-second decisions of a news-driven market, our AI Trading Bot already has a plan — and it doesn’t get emotional when RSI hits single digits.
Gold Market Overview: Bears Tighten Their Grip Ahead of ISM
Sentiment in the gold market has turned sharply negative as the US trading session begins. The Dollar Index (DXY) is flexing its muscles, extending gains from the overnight session on expectations that today’s ISM Manufacturing release will beat the 53.3 forecast, up from 52.7 prior. A print above 50 isn’t just expansionary — in this macro environment, it’s a green light for hawkish Fed rhetoric, further boosting the greenback and crushing non-yielding assets like gold.
The backdrop is also notable for what it isn’t doing. Geopolitical tensions in the Middle East — namely the US-Iran standoff and renewed attacks in Lebanon — have so far failed to provide any safe-haven bid. Instead, traders are fading any short-lived spikes, treating them as selling opportunities. Silver is actually up 0.89% on the day, which makes gold’s underperformance even more striking; this is a gold-specific capitulation, not a broad precious-metals rout. With NFP and ISM Services still to come later this week, the path of least resistance for XAU/USD seems lower, but the speed of today’s drop is now creating technical conditions that demand respect.
Technical Analysis: Oversold Alarms Ring on Every Chart
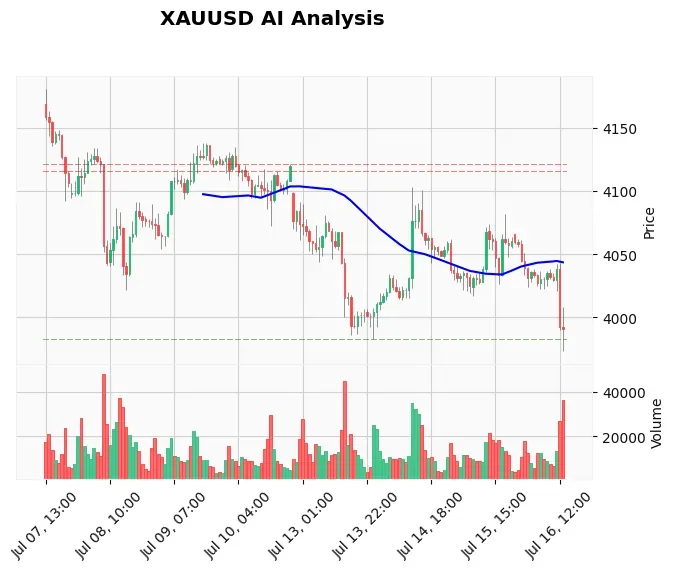
Let’s talk levels, because the numbers don’t lie. Our latest TradingView webhook paints a stark picture: the hourly RSI has plummeted to 25.97, deep into oversold territory. The MACD is printing a bearish signal at -9.04 against a signal line of -1.94, showing extreme downside momentum with no immediate sign of a bullish crossover. Price has sliced through all three key EMAs — the 20-period at 4508.52, the 50-period at 4506.08, and the 200-period at 4519.04 — with the conviction of a bearish freight train.
Support and resistance are now redefined. The immediate support at $4,453.53 (S2) has already been broken intraday, with the low touching $4,448.86. That turns S2 into near-term resistance on any minor bounce, while the far more substantial demand zone sits at $4,366.29 (S1), a level that hasn’t been tested in weeks. On the upside, the first significant hurdle is the $4,570–4,580 resistance cluster, which is miles away and irrelevant for short-term scalpers. What matters right now is that the ATR of $18.90 suggests true-range volatility is elevated; we could easily see a 20-dollar rip in either direction once the ISM number drops. If you’re reading this before the release, check your stop-loss placement — the market will not wait.
Fundamental Drivers: The ISM Number Is the Only Thing That Matters
All eyes in the American session are locked on the Institute for Supply Management’s Manufacturing PMI, set to hit the wires within the next few minutes. The forecast of 53.3 implies a significant jump from the previous 52.7, and the whisper number may be even higher given the recent run of strong US data. A beat would be unequivocally bearish for gold: it reinforces the narrative that the US economy is resilient, keeps interest-rate-cut expectations in check, and sends the Dollar soaring. In such a scenario, the $4,460 area would be the first logical target, followed by a potential cascade toward the $4,430 zone.
Conversely, a miss — say, a print at 52.5 or below — could trigger a violent unwinding of long-Dollar positions. Gold would likely spike back toward the $4,500–4,520 resistance zone within seconds. That’s precisely why our management team just canceled the pending sell-limit at $4,535; the risk of a short-term news-driven whipsaw into that order was deemed unacceptable. For traders who want to catch these high-impact moves without babysitting the screen, our News Trading Bot is purpose-built for exactly this kind of volatility, executing trades based on real-time economic deviations.
Devil’s Advocate: The Case for a Sudden Gold Rally
No analysis is complete without challenging the dominant bias, and there is a coherent case for a bounce that could wrong-foot aggressive shorts. The RSI at 25.97 is not a mild oversold reading — it’s a scream that selling has gone too far, too fast. Seasoned traders know that such extreme readings on the one-hour chart often precede snap-back rallies, especially when a high-impact news event is on the horizon. If the ISM data disappoints, the combination of stopped-out bears and fresh bulls could propel XAU/USD back above the $4,500 psychological level in a matter of minutes.
The invalidation point for this contrarian view would be a clean acceptance below the $4,448 low after the news settles. If gold prints a new low and holds there for more than a few minutes, the bounce thesis is dead, and the path to $4,366 becomes wide open. Either way, the next thirty minutes will determine the directional bias for the remainder of the US session.
Trading Strategy for This Session: Wait, Then Pounce
Trading gold into a high-impact release without a clear pre-positioned order is a recipe for disaster. The AI engine’s decision to “WAIT” and cancel the distant sell-limit is the correct one. Here’s a battle plan for the next few hours:
- Scenario A — ISM beats expectations (bearish continuation): Look for a rejection of the immediate resistance at $4,468–4,472 (the 15-minute breakdown level). A short entry in this zone with a stop above $4,485 and a target at $4,460 offers a favorable risk-reward profile, especially if volume confirms the move.
- Scenario B — ISM misses (bullish reversal): A break back above $4,500 with conviction turns the bias bullish intraday. Wait for a retest of $4,500 as support, then target the $4,520 supply zone where the 200 EMA is sitting. A stop under $4,480 would be prudent.
- Scenario C — Choppy, directionless price action: If the market whipsaws and doesn’t commit, don’t force a trade. Sit on your hands and wait for the dust to settle. The real move may come in the second half of the session.
If you’d prefer not to manually manage these fast-paced scenarios, consider letting our Price Action Pro EA do the heavy lifting. It reads market structure, not just thresholds, and is superb at navigating news-driven volatility.
Risk Management: Position Sizing for a 20-Dollar Range
An ATR of $18.90 means that in normal conditions, gold moves nearly 19 dollars per hour. During a news spike, that range can double or triple in seconds. If your stop-loss is too tight, you will be knocked out by noise before the real move begins. A good rule of thumb today is to risk no more than 1% of your account on any single trade and to set your stop at least $12–15 away from entry, even for a scalp.
For a short entry at $4,470, for instance, a stop at $4,485 gives you a 15-dollar risk. If you’re taking a 10-dollar profit target, your risk-reward is 1:0.66 — not great. That’s exactly why waiting for a clear, high-probability setup is critical; the math has to work in your favor. Above all, do not double down on a losing position. The market will humble anyone who tries to fight the ISM release.
Frequently Asked Questions
Is gold going to keep falling after the ISM data?
If the ISM Manufacturing PMI beats the 53.3 forecast, downward pressure on gold is likely to continue, with the immediate targets at $4,460 and $4,430. However, the oversold RSI suggests that any downside may be limited without a brief consolidation or bounce. The key level to watch is $4,500 — a sustained break above that would flip the short-term outlook.
What is the best support level for XAUUSD right now?
The nearest structurally significant support is at $4,453, though it has already been breached intraday. A more reliable floor sits at $4,366, derived from the daily webhook's S1. Below that, the next major zone is around $4,320, but a move that far would almost certainly require a headline shock.
How does the ISM Manufacturing PMI affect gold prices?
A higher-than-expected ISM reading signals economic expansion, which boosts the US Dollar and raises the opportunity cost of holding gold. This typically sends XAU/USD lower. A weaker reading suggests a slowing economy, weakens the Dollar, and gives gold a bid as safe-haven flows return.
Can I trade gold news with an automated bot?
Yes. Automated systems specifically designed for news trading, such as the News Trading Bot available on our marketplace, can execute trades within milliseconds of a data release, catching the initial volatility that manual traders often miss. Pairing it with a reliable Windows VPS for Gold trading ensures low latency and 24/7 uptime.
Is it safe to hold a gold position overnight with NFP this week?
Holding a position overnight during a week that includes NFP, ISM Services, and ADP data carries elevated risk. If you do maintain a swing trade, keep your leverage low and ensure your stop-loss is wide enough to withstand potential gap moves at the Asian open. Alternatively, following live professional XAU/USD signals can help you navigate the volatility with expert guidance.
Conclusion
The XAUUSD US session forecast June 01 is one of high alert, not blind aggression. The breakdown below $4,500 is real, the momentum is bearish, and the ISM release could easily accelerate the drop toward $4,460. Yet the oversold RSI at 25.97 is a loud warning that shorts are crowded and a reversal could be violent. The prudent approach is exactly what our AI engine is doing: wait for the news to pass, let the market show its hand, and only then execute a setup with a valid edge. If you’d rather not sit through the chaos, our AI Trading Bot continues to scan XAU/USD around the clock, making emotion-free decisions with an 83%+ win rate. Whatever you do, keep your risk tight, your stops sensible, and your eyes on the ISM number — the next thirty minutes will set the tone for the entire week.
Trading Gold (XAU/USD) involves significant risk of loss. This content is for informational purposes only and does not constitute financial advice. Always conduct your own research and trade responsibly.