
Gold Traders Beware: $3,742 Level Cracks Under Fed Pressure
Gold is trading near $3,753 in the early hours of the Asian session, and the number that matters most is not the price on the screen — it is $3,742. That level held as support for weeks. Overnight it flipped into a ceiling, and the bounce you are watching is a test of that broken floor, not a recovery. This XAUUSD Asian session outlook November 19 breaks down why the bounce is fragile, where the real invalidation sits, and how to position around a market that just printed a 14-month low.
The bigger picture is uncomfortable for anyone still long. Gold broke below $3,800 on Wednesday, hit its lowest level since September 2025, and the H1 chart is a textbook downtrend of lower highs and lower lows. The bounce off $3,719.72 is real, but it is happening inside a bearish structure, not against it.
Want to trade this Gold setup automatically? Our AI Trading Bot runs 24/7 on XAU/USD with an 83%+ win rate.
Gold Market Overview
Sentiment is decisively negative. Multiple sources confirm gold broke below $3,800 to a 14-month low on hawkish Fed rhetoric, and the FOMC minutes released Wednesday put a bigger December hike firmly in play. Waller floated a 50bp move to break the 3% inflation mindset, Kashkari argued markets see more hikes than officials do, and a couple of participants raised the possibility of more than 25bp. Four Fed voices turned hawkish in a single session.
The dollar and front-end Treasury yields are firm, and that combination is the single most reliable headwind for a non-yielding asset. Silver is falling faster than gold — down more than 4% on Wednesday to levels last seen in October 2025 — which confirms this is a rising-rates theme rather than a gold-specific story. When silver underperforms on the way down, the market is pricing policy, not panic.
There are no high-impact USD events in the immediate window, so the Asian session has no scheduled catalyst. That matters: without a data release to force a repricing, the path of least resistance is the trend already in place. The macro driver is unambiguously USD and yields up, gold down.
Technical Analysis
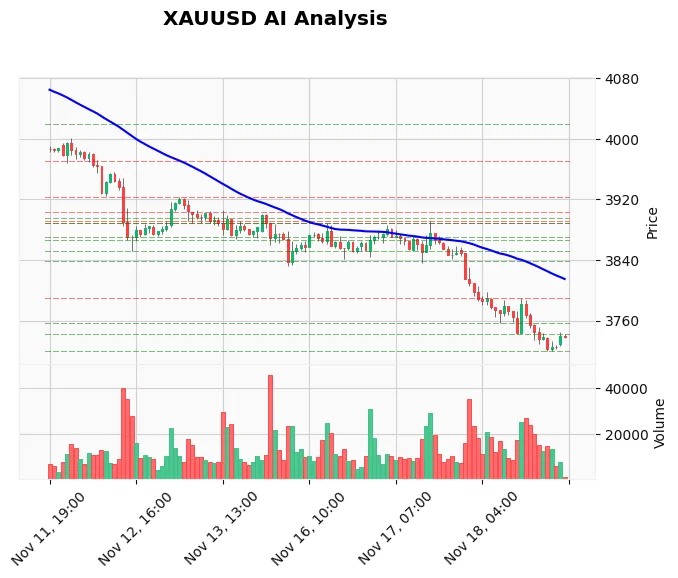
The H1 EMA stack is short and stacked against the price. Gold trades at $3,753.54, below the EMA20 at $3,760.37, the EMA50 at $3,801.51, and the EMA200 at $3,907.80. That is a clean, fully aligned bearish structure, and the ADX at 38.02 with DI- at 26.46 against DI+ at 18.03 confirms the downside trend has real strength behind it.
Momentum is where the nuance lives. RSI sits at 42.92 on H1 and just 28.58 on H4, with the daily reading at 32.58 — deeply oversold on the higher timeframes. MACD is at -23.42 with the signal at -25.30 and a positive histogram of 1.89, which is the signature of a counter-trend bounce losing steam rather than a trend reversal. Stochastic at 28.50/16.81 is climbing off the floor. ATR at 18.61 tells you the session is not yet violent, but it is wide enough to punish tight stops.
The level map is the whole story. The $3,742.80 pivot — a broken support with four H1 touches — is now the first resistance below the $3,757.23 cluster, which carries five touches and sits just 72 pips above spot. Above that, $3,790.43 is the nearest swing high with six touches. To the downside, $3,719.72 is the swing low and the prior day's low at $3,720.00, a confluence that has already produced one bounce. The weekly low at $3,852.62 is now far overhead and irrelevant to intraday positioning.
Fundamental Drivers
The dominant event is the hawkish Fed repricing. The FOMC minutes showed more rate hikes likely as inflation risks persist, and the market is now leaning toward a larger December move than officials had signalled. That is the engine behind the 14-month low, and it does not reverse on a quiet Thursday morning.
Geopolitical safe-haven demand is not providing the usual offset. Reports questioning the dirty bomb narrative have added to market uncertainty rather than gold bids, and one widely circulated piece argues gold is reliving 2022 with a selloff that is already worse. When safe-haven headlines fail to lift the metal, the rate story is in full control.
The next key event is the December FOMC meeting, and every hawkish headline between now and then is a headwind. If you trade the news flow rather than the chart, the News Trading Bot is built to handle high-impact releases without you sitting at the screen.
Devil's Advocate
The bearish case has one genuine flaw: price is mid-bounce into resistance with H4 RSI at 28.58, and the SMC read flags an internal long inside a discount zone. Shorting a deeply oversold market directly into a counter-trend pop is how good theses produce bad entries.
What invalidates the bearish bias? A clean H1 close above $3,757.23 followed by acceptance above $3,790.43 would break the lower-high sequence and force a rethink. The key reversal level is $3,790.43 — reclaim that and the downtrend structure is compromised. Until then, bounces are selling opportunities, not trend changes.
Trading Strategy for This Session
The highest-probability play is a sell into strength, not a chase at market. Wait for price to push into the $3,757–$3,760 zone, where the broken support cluster and the EMA20 converge, and look for rejection. An entry near $3,757 with a stop above $3,775 keeps risk tight and sits above the structural pivot. The first target is $3,742.80, the second is $3,719.72, and a break of that opens the $3,700 handle.
Work the numbers before you click. From a $3,757 entry to the $3,742.80 first target is 14.20 dollars; to the $3,719.72 second target is 37.28 dollars. Against an 18-dollar stop that is roughly 0.8:1 on the first scale-out and just over 2:1 on the runner — which is why the first target is a partial, not an exit. Take half at $3,742.80, move the stop to breakeven, and let the remainder ride toward the swing low. If $3,742.80 rejects hard and price stalls there for more than a couple of H1 candles, that is your signal the bounce has run out of buyers and the second leg is loading.
If price instead rolls over immediately without tagging the zone, do not chase. The existing short thesis from the desk sits at $3,725.67 with a stop at $3,758.00 and a target of $3,705.68, and that positioning already captures the move. Patience is the edge here.
The most common mistake in this setup is entering at market the moment you see the bounce, because the entry sits mid-range with the stop below the $3,719.72 low — a 35-dollar risk for a 14-dollar first target. That is a negative expectancy trade dressed up as a bearish thesis, and it is exactly how a correct directional call still loses money. The second mistake is widening the stop after price pushes through $3,775, which turns a controlled 18-dollar loss into an open-ended one in a market that has already shown it can bounce 35 dollars off a low.
For traders who want the structure executed without manual monitoring, the Price Action Pro EA reads order blocks and liquidity sweeps on XAU/USD and can hold the bias while you sleep.
Risk Management
Position size for a 20-dollar stop, not a 5-dollar one. ATR at 18.61 means a normal Asian session candle can travel most of your stop distance, so risking more than 1% of account equity on this setup is asking for a noise-out. The reward-to-risk on the $3,757 entry with a $3,775 stop and a $3,719 target is roughly 2:1, which is acceptable but not generous.
If the trade fails and price closes above $3,775, take the loss and stand aside. Do not average into a losing short in a market that has already shown it can bounce 35 dollars off a low. Re-entry only comes on a fresh rejection at a higher level.
FAQ
Is gold going to fall further today?
The trend structure favours more downside, with $3,719.72 as the first real target and $3,700 below that. The caveat is that H4 RSI at 28.58 is oversold, so a bounce toward $3,757 can happen first. Direction is bearish; timing is the open question.
What is the key level to watch in the Asian session?
$3,742.80. It was support and is now resistance. A rejection there keeps the bearish structure intact, while a sustained break above $3,757.23 would signal the bounce has more room.
Why is gold falling when there is geopolitical uncertainty?
Rate-hike expectations are overwhelming safe-haven demand. When the Fed is expected to hike more than previously priced, the dollar and yields rise, and gold pays no yield. Silver falling faster than gold confirms the rising-rates theme.
What would change the bearish outlook?
A daily close above $3,790.43 would break the sequence of lower highs and force a reassessment. Until that happens, rallies into resistance are selling opportunities within a downtrend.
Final Take
The $3,742 level cracking is the signal that matters this morning. Gold bounced off $3,719.72, but it bounced into a wall of broken support and a fully stacked bearish EMA structure, with the Fed providing the fundamental tailwind for the dollar. The trend is down on H1, H4, and the daily, and the ADX confirms it has strength.
Watch $3,757.23 as the line in the sand for the bounce and $3,719.72 as the line in the sand for the breakdown. Trade the rejection, not the middle of the range. If you want that discipline automated, the automated Gold bot with 83% win rate executes the same structure rules around the clock.
Trading Gold (XAU/USD) involves significant risk of loss. This content is for informational purposes only and does not constitute financial advice. Always conduct your own research and trade responsibly.