
Gold Breaks $3,800 After Hawkish Fed Bets, Target $3,735
The Gold price today November 18 2026 Europe is $3,774, and the number that matters is not the level itself but what sits beneath it: nothing. XAU/USD broke below the $3,800 psychological floor in Asian hours and has not looked back, printing a session low at $3,764.40 before a weak bounce. This is gold's lowest print since September 2025, and the move is being driven by a 5% Treasury yield and a market that has decided the Fed is not coming to the rescue.
For European traders arriving at the desk, the setup is uncomfortable but clear. The H1 EMA stack is short, ADX reads 28 with DI- at 33.65 against DI+ at 10.29, and price is trading at the very bottom of the sampled range with no structural support below. The nearest resistance is 669 pips away at $3,838.29. That is a vacuum, not a floor.
Want to trade this Gold breakdown automatically while you sleep? Our AI Trading Bot runs 24/7 on XAU/USD with an 83%+ win rate and has been short this move since the $3,800 break.
Gold Market Overview
The macro backdrop is uniformly hostile to the yellow metal this morning. Gold is trading at $3,774 after opening the day at $3,848.97 and the week at $3,883.89, meaning the market has given back roughly $110 from the weekly open in two sessions. The dollar is firm, having fully erased the tariff shock that dominated headlines earlier in the quarter, and the 5% Treasury yield is doing the damage that geopolitical risk used to do.
Silver confirms the story. XAG/USD has dropped to 13-month lows around $45.80 per troy ounce, and the ratio between the two metals is widening in a way that only happens when the market is pricing a hawkish Fed rather than a safe-haven bid. When silver leads gold lower, it is almost never a geopolitical move — it is a rates move.
The sentiment picture is one-sided. Headlines from FXStreet, Investing.com and Reuters all describe the same thing: gold at a one-year low, selling pressure intensifying, and traders looking to the FOMC Minutes for direction. The lone bullish outlier — a $7,000 long-horizon target — is a contrarian piece, not a tradeable catalyst for today's session.
What matters for the European session is positioning. The market is leaning hawkish into tonight's FOMC Minutes, and that means the risk is asymmetric: a hawkish read extends the selloff, while a dovish surprise produces a relief bounce into resistance rather than a trend change.
Technical Analysis
The H1 chart is a textbook bearish stack. Price at $3,774 sits below EMA20 at $3,820.56, EMA50 at $3,849.05 and EMA200 at $3,935.11, with each average sloping down and fanning apart. The H4 tells the same story — close at $3,774.20, EMA50 at $3,924.75, EMA200 at $4,051.09 — and the Daily confirms it with EMA50 at $4,088.86 and EMA200 at $4,230.49 far overhead.
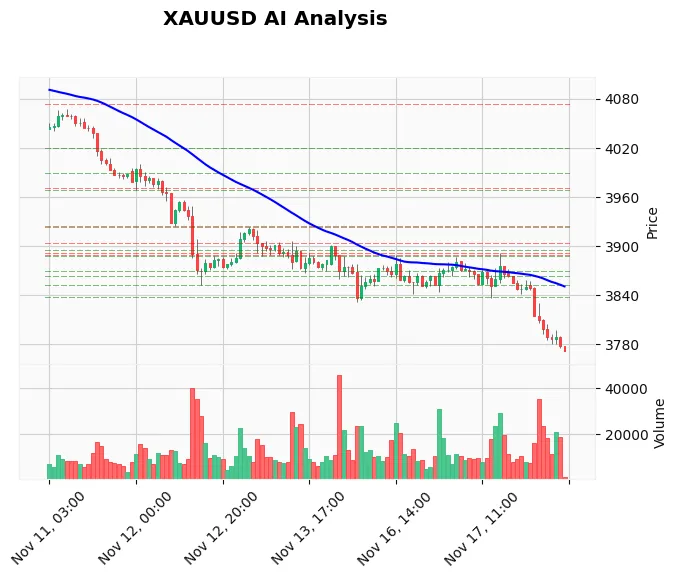
Momentum is deeply oversold and that is the one caution. RSI on H1 reads 22.13, Stochastic is pinned at 6.50/5.67, and H4 RSI is 23.78. MACD is negative at -22.74 with the signal at -15.97 and a histogram of -6.77, still expanding. ATR is 17.02, which tells you the average H1 range is wide enough that a 30-pip stop is inside the noise.
Structure is the key. Support below price is effectively absent — S1 at $3,764.40 and S2 at $3,763.59 are the only pivots, and both are within 10 pips of the current print. Resistance above is clustered at $3,838.29 (H1, three touches), $3,852.30 (H4, nine touches) and $3,862.89 (H1, 27 touches). The prior day's low at $3,836.98 and the prior week's low at $3,852.62 have both flipped from support to resistance. Price Action V3 confirms swing short, internal short, and a bearish trendline breakout, with price sitting in the discount zone at 0.08 of the swing range.
Fundamental Drivers
Two forces are doing the work today. The first is the 5% Treasury yield, which investingLive described bluntly as gold's "worst enemy right now" — not the Middle East headlines. When the risk-free rate pays that much, the opportunity cost of holding a non-yielding asset becomes the dominant variable, and gold sells off regardless of geopolitics.
The second is the FOMC Minutes, due in roughly 11 hours. The market is positioning hawkish into the release, and the break below $3,800 removes a psychological level that had been defended for weeks. If the minutes read hawkish, the path of least resistance is lower. If they read dovish, expect a squeeze into the $3,838-$3,852 resistance band rather than a reversal.
For traders who want to trade the minutes release without sitting at the screen, our News Trading Bot is built specifically for high-impact USD events like this one.
Devil's Advocate
The bearish case has one real weakness: RSI at 22 on H1 and 31.97 on the Daily is stretched, and stretched markets bounce. The H1 candle that just closed is a bullish pin bar, which is the first sign of buyers stepping in at the lows. If price reclaims $3,800 and holds above it into the London fix, the breakdown becomes a fakeout and the target flips to $3,838.
The invalidation level is $3,838.29. A close above that level on H1 would break the sequence of lower highs and put the bearish structure on hold. Until then, rallies are selling opportunities, not reversals.
Trading Strategy for This Session
The strategy is to sell into a minor bounce rather than chase the low. The ideal entry zone is $3,780-$3,790, which is the retest of the broken $3,800 level from below and sits just under the H1 EMA20 at $3,820.56. Entering there gives a stop above the $3,803.74 level from the signal log, which is 300 pips above the original entry and beyond the immediate noise.
For traders who prefer a mechanical approach, the signal log has a live SELL at $3,771.74 with a stop at $3,803.74. Take Profit 1 sits at $3,753.74, Take Profit 2 at $3,735.74, and the final measured target at $3,711.74. The risk-reward on the first target is roughly 0.6:1, which is why scaling out matters here — the second and third targets carry the real payoff.
If you would rather have the execution handled for you, the Price Action Pro EA reads structure like this automatically and manages the trailing stop as price extends into the void.
The one rule for today: do not sell the exact low. Wait for the bounce into $3,780-$3,790, or wait for a clean H1 close below $3,764.40 to confirm continuation. Chasing at $3,774 with a 30-pip stop is how accounts get stopped out on noise before the move happens.
Risk Management
Position sizing matters more than usual because ATR is 17.02 and the FOMC Minutes land in the middle of the New York session. A 300-pip stop on a standard lot is $300 of risk per lot, so size to 1% of account equity or less. If the trade moves 100 pips in your favor, move the stop to breakeven and let the remainder run toward $3,735.
If price closes above $3,838.29 on H1, the thesis is wrong — cut the position and reassess. Do not average into a losing short during a news release. The market will give you another entry.
FAQ
Q: What is the Gold price today November 18 2026 in Europe?
Gold is trading at $3,774 in the European session, down 0.09% on the day, after printing a session low of $3,764.40. The metal broke below the $3,800 psychological level in Asian hours and is at its lowest since September 2025.
Q: Why is gold falling below $3,800?
Two reasons. First, the 5% Treasury yield is raising the opportunity cost of holding a non-yielding asset. Second, the market is positioning hawkish into tonight's FOMC Minutes, and the break of $3,800 removed a psychological support that had been defended for weeks. Silver at 13-month lows confirms this is a rates-driven selloff, not a geopolitical one.
Q: What are the key support and resistance levels for XAU/USD today?
Support is thin: S1 at $3,764.40 and S2 at $3,763.59 are the only pivots below price. Resistance sits at $3,838.29, then $3,852.30 and $3,862.89. The prior day's low at $3,836.98 and prior week's low at $3,852.62 have both flipped to resistance.
Q: What happens to gold if the FOMC Minutes are hawkish?
A hawkish read extends the selloff toward $3,753.74 and then $3,735.74, with the final measured target at $3,711.74. A dovish surprise produces a relief bounce into $3,838-$3,852, but that is a selling opportunity rather than a trend change unless price closes above $3,838.29 on H1.
Q: Is now a good time to buy gold?
The trend, structure and fundamentals all point lower, and there is no structural support below price. Buying into a support void with a bearish EMA stack is a counter-trend trade. If you want to buy, wait for a daily close above $3,838.29 to confirm the breakdown has failed.
Conclusion
The Gold price today November 18 2026 Europe is $3,774, and the story is a clean breakdown with nothing underneath. The 5% Treasury yield and hawkish Fed positioning have done what geopolitical risk could not, and the H1 EMA stack, ADX at 28 and Price Action V3 all agree on direction. The one caution is oversold momentum, which argues for selling a bounce into $3,780-$3,790 rather than chasing the low.
The level that matters is $3,838.29. Below it, the path of least resistance is $3,753.74 and then $3,735.74. Above it, the thesis is wrong. Watch the FOMC Minutes tonight — that is the catalyst that decides whether the void gets filled or the breakdown gets reversed.
If you want to trade this setup without watching every candle, our automated Gold bot with an 83% win rate is already positioned short and manages the trailing stop automatically. For traders who prefer to follow the structure manually, the live Gold trading signals service publishes the same levels in real time.
Trading Gold (XAU/USD) involves significant risk of loss. This content is for informational purposes only and does not constitute financial advice. Always conduct your own research and trade responsibly.