How to Use RSI in Gold Trading: A Complete Guide
Every day, I see traders dumping money into XAUUSD without understanding momentum. They buy after a big move only to watch Gold reverse and stop them out. Why? Because they ignore one of the most reliable tools we have: the Relative Strength Index, or RSI. If you trade Gold without RSI, you're trading blind. In this guide, I'll show you exactly how to use RSI in Gold trading — not just theory, but real setups that work in the current market environment. And if you'd rather let an algorithm handle the analysis, our AI Trading Bot executes RSI-based strategies automatically with a proven 83% win rate.
What Is RSI?
The Relative Strength Index (RSI) is a momentum oscillator that measures the speed and change of price movements. Developed by J. Welles Wilder, it ranges from 0 to 100. Traditionally, readings above 70 indicate overbought conditions, while readings below 30 indicate oversold conditions. The default period is 14, meaning it looks back at 14 candles. In Gold trading, this standard setting works well for daily and 4-hour charts, but I often adjust it to 9 or 21 for more sensitive or smoother readings, depending on the market's volatility.
RSI is not just about overbought and oversold. Its true power lies in divergence — when price makes higher highs but RSI makes lower highs (bearish divergence) or price makes lower lows but RSI makes higher lows (bullish divergence). This often precedes major reversals in Gold.
Why It Matters for Gold Traders
Gold (XAUUSD) has a unique habit of trending strongly during geopolitical or macroeconomic stress. During these trends, RSI can stay overbought for weeks. A beginner might short at 70 only to watch Gold rally another 500 pips. That's why understanding trend context is crucial when using RSI. In a strong uptrend, wait for RSI to pull back to 40-50 before buying. In a downtrend, wait for RSI to rally to 60-70 before selling. This keeps you trading with the trend instead of against it.
Also, Gold often exhibits clear divergences at key turning points like Fed announcements or support/resistance levels. Learning to spot these gives you an edge over retail traders who only look at the price chart.
How to Use It Step by Step
Follow these steps to integrate RSI into your Gold trading routine:
- Choose the right timeframe. For swing trades, use the 4-hour or daily chart. For day trading, the 1-hour chart works well. Avoid timeframes below 15 minutes unless you're scalping with other confluences.
- Identify the trend first. Use a simple 200-period moving average on the daily chart. If price is above it, only look for bullish RSI setups. If below, focus on bearish setups.
- Plot the RSI with default 14-period setting. In MT4, drag the oscillator from the Navigator onto your chart. Right-click the RSI line, select 'Properties', and set levels at 30 and 70.
- Look for oversold/overbought extremes. In an uptrend, wait for RSI to dip below 30. That's a high-probability buy zone. In a downtrend, wait for RSI to rise above 70 for short entries.
- Confirm with divergence. Draw a line connecting the lows or highs on price and compare it to the RSI. When they diverge, prepare for a trade. Enter when price breaks a recent swing point or trendline.
- Set stop loss and take profit. Place your stop 5-10 pips below a recent swing low for bullish setups, or above a swing high for bearish setups. Target the next key support/resistance level or a 1:2 risk-to-reward ratio.
For more advanced automation, consider using our Price Action Pro EA, which combines RSI with market structure and order blocks to execute trades without emotional bias.
Common Mistakes Gold Traders Make
Even experienced traders fall into these traps:
- Treating 70/30 as automatic reversal signals. In a strong trend, RSI can remain overbought or oversold for extended periods. Always confirm with price action.
- Using RSI without trend context. Buying because RSI is oversold while Gold is in a bear market is a recipe for losses.
- Ignoring divergence until it's too late. Divergence often appears early. Many traders wait for price to reverse, but by then the move is half over.
- Overusing RSI on low timeframes. M1 and M5 RSI is noisy and prone to false signals. Stick to H1 and above for reliable setups.
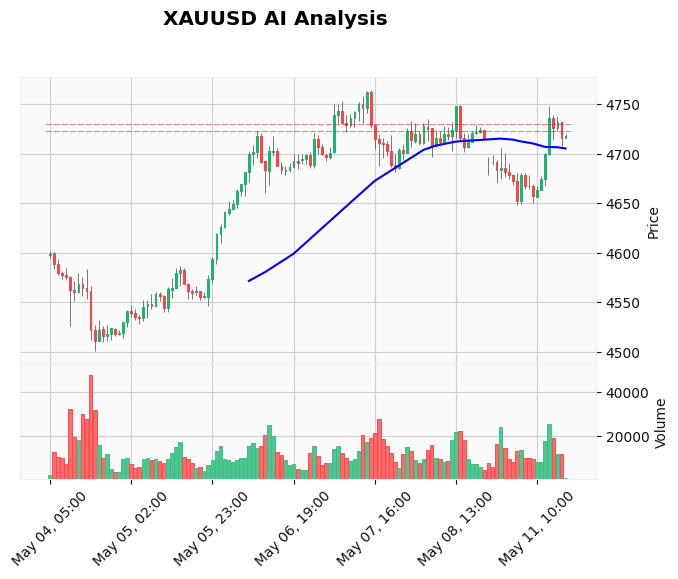
Real Example on XAUUSD Chart
Let's look at a recent opportunity. In early May 2026, Gold rallied from $2,250 to $2,380. The daily RSI hit 78, clearly overbought. But because the trend was up, a contrarian short would have been premature. However, a bearish divergence appeared: price made a higher high at $2,380, but RSI made a lower high at 72. That was the real signal. Price then pulled back over 60 pips to $2,320. Traders who recognized this divergence and entered short near $2,370 with a stop above $2,390 and a target at $2,320 achieved a perfect 2:1 risk-reward. If you want to catch these moves automatically, try our daily Gold trading signals that highlight RSI divergence setups before they erupt.
Frequently Asked Questions
What is the best RSI setting for Gold?
The default 14-period RSI works well for most Gold traders. Day traders often use 9 for faster signals, while swing traders prefer 21 to filter out noise. Test each on a demo account to see which suits your style.
Does RSI work for day trading Gold?
Yes, but with caution. On the 1-hour chart, RSI divergence signals are reliable. On shorter timeframes, combine RSI with support/resistance and avoid relying solely on overbought/oversold levels.
How to use RSI divergence in Gold trading?
Draw a line connecting the price peaks (or troughs) and a separate line on the RSI. If price makes a higher high but RSI makes a lower high, that's bearish divergence. Enter short after a bearish candlestick pattern forms. For bullish divergence, do the opposite.
Can RSI be used for stop loss placement?
Absolutely. In an uptrend, place your stop below the most recent swing low that coincided with an RSI reading below 30. In a downtrend, place your stop above the swing high that saw RSI above 70. This aligns your risk with momentum extremes.
Conclusion
RSI is a versatile tool that every Gold trader should master. Focus on using it with the trend, look for divergences at key levels, and never trade it in isolation. Practice on a demo account until you can spot RSI setups in seconds. When you're ready to take the next step, let our AI Trading Bot handle the heavy lifting — it scans multiple timeframes for RSI divergences and overbought/oversold opportunities 24/7.
Disclaimer: Trading Gold (XAU/USD) involves significant risk of loss. This content is for informational purposes only and does not constitute financial advice. Always conduct your own research and trade responsibly.