Gold Price Forecast May 11 2026 Asia Open: Bulls Beware as $4,680 Support Cracks
The Asian open on May 11, 2026, finds gold in a delicate position. After closing Friday at $4,683, the Gold price forecast May 11 2026 Asia open points to a cautious start with immediate support near $4,680 being tested. Short-term momentum has faded—RSI sits at 39, well below 50—and price remains below both the 20 and 50 EMA. With high-impact US CPI data looming in 36 hours, traders are reluctant to commit aggressively. This session is likely to be one of consolidation or a minor dip, not a breakout. To protect your capital, consider letting our AI Trading Bot handle the uncertainty with automated precision.
Gold Market Overview
Monday’s Asian session opens with a neutral-to-bearish tilt. The US Dollar is steady after Friday’s mixed jobs data, while geopolitical headlines—Middle East peace hopes and ongoing Iran negotiations—provide a mixed backstop for gold. Indian ETF inflows continue for an 11th straight month, supporting the long-term bid, but the short-term picture is clouded by rising inflation expectations. The market is pricing in a 0.3% Core CPI m/m, up from 0.2%, which could reignite Fed hawkishness. Until that data prints, gold is likely to drift lower within a tight range.
Technical Analysis
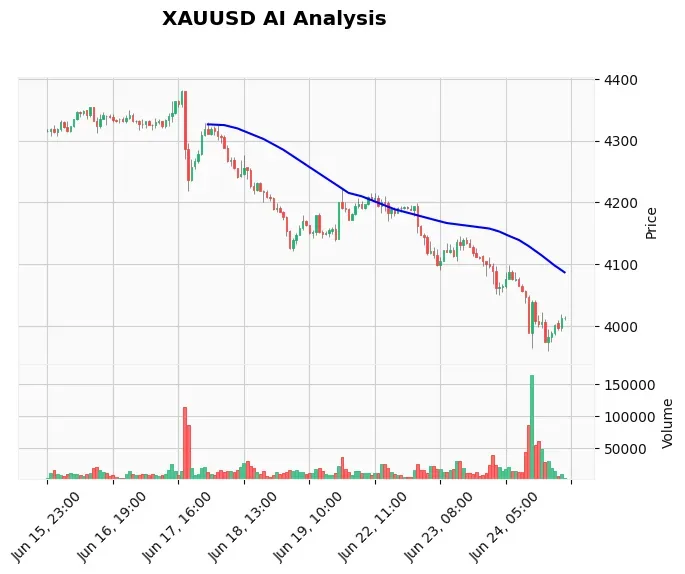
From the latest TradingView data (0.02 hours old), XAUUSD is trading at $4,683.64. The daily trend remains bullish, but the hourly chart shows clear weakness:
- EMA Structure: Price ($4,683) is below the 20 EMA ($4,710.51) and 50 EMA ($4,702.63). Only the 200 EMA ($4,662.86) provides support below.
- RSI (14): 39.04 — firmly in bearish territory, suggesting selling pressure.
- MACD: -3.99 vs signal line 0.40 — bearish cross intact, histogram deepening.
- ATR: 19.46 — typical intraday range, but narrow by recent standards, implying indecision.
- Key Levels from data: Support at $4,500.57 (S1) and $4,510.31 (S2) are far below. Near-term support from AI analysis is $4,680. Resistance is $4,700–$4,715 (area of prior buy limits) and the 20 EMA near $4,710.
A break below $4,680 could accelerate the slide toward $4,660 (R2 from webhook, now acting as support) and then $4,630. The daily chart shows a bullish macro structure, but the H1 chart is breaking down. Traders should watch for a reclaim of $4,700 to invalidate bearish pressure. For a live view, check our Gold technical analysis tools.
Fundamental Drivers
The macro story is dominated by the upcoming US CPI release on Wednesday. Forecasts are mixed: Core CPI expected to rise to 0.3% (from 0.2%), while headline CPI is seen slowing to 0.6% (from 0.9%). A hot core reading would dent hopes for rate cuts and strengthen the dollar, pressuring gold. Meanwhile, geopolitical factors provide a floor: Middle East peace negotiations are reportedly progressing, which historically reduces safe-haven demand, but any setback could reverse that. Additionally, India’s persistent gold ETF demand is a structural tailwind. In the short term, however, the pre-CPI caution keeps gold under water. Use our News Trading Bot to trade the CPI release automatically without emotional hesitation.
Devil’s Advocate: What If Bulls Are Wrong?
While the daily trend remains bullish, the daily chart is showing signs of exhaustion. If $4,680 fails to hold and the session closes below $4,660, the bullish case weakens significantly. The next major support is $4,550 (a prior consolidation zone). Furthermore, the RSI below 40 suggests momentum is firmly with sellers. A break below the 200 EMA at $4,662 would signal a deeper correction. Bulls need to see price recover above $4,710 (20 EMA) by the European open to regain control. Until then, the path of least resistance is lower.
Trading Strategy for This Asian Session
Given the WAIT signal from our AI analysis and the pending CPI risk, the best approach is patience. However, for active traders, we recommend a low-risk scalping strategy:
- Bias: Bearish intraday, but only for short scalps.
- Sell Zone: $4,690–$4,700 (if price retests resistance). Stop loss above $4,715.
- Targets: TP1 at $4,680, TP2 at $4,665.
- Buy Zone: Only if price holds $4,680 and forms a bullish reversal pattern (e.g., pin bar). Then buy with stop below $4,660, target $4,705.
- Risk-Reward: Minimum 1:2. Position size small — 0.5% risk per trade.
For hands-free trading, consider our Price Action Pro EA, which automatically detects SMC patterns and executes entries with proper risk management.
Risk Management
The high uncertainty before CPI demands strict risk control. Set stop losses at technical invalidation levels, not arbitrary pips. For short trades, a stop above $4,715 is safe. For long trades, a stop below $4,660. Keep leverage low — gold can whip 1.5 ATR ($29) in minutes during low liquidity. If the trade goes against you quickly, do not average down. Respect the levels and wait for the next setup. Our live Gold trading signals provide real-time entry alerts with built-in risk rules.
FAQ
Q: Why is gold falling in the Asian session on May 11?
A: Gold is under pressure due to fading short-term momentum (RSI 39) and positioning ahead of Wednesday's CPI data. The market is reducing risk exposure, and the lack of fresh catalysts overnight allows technical selling to dominate. Immediate support at $4,680 is being tested.
Q: Is $4,680 a strong support level for XAUUSD today?
A: Yes, $4,680 has acted as a buy limit zone historically, but with RSI below 40 and price below both 20 and 50 EMAs, it is vulnerable. A break below could trigger stops and accelerate the decline toward $4,660 and $4,630. Watch for a daily close above $4,700 to confirm support holds.
Q: What impact will US CPI data have on gold this week?
A: The Core CPI m/m forecast of 0.3% (up from 0.2%) is the key. A higher-than-expected reading would strengthen the dollar and likely push gold down to $4,550 or lower. A miss to the downside could fuel a rally back above $4,750. Trade cautiously until the release.
Q: Should I trade gold today before CPI?
A: Only if you are a day trader with strict stops. The market is likely to drift in a low-volatility range until the news. Scalping small moves of $10–15 within the $4,660–$4,700 zone is possible but requires discipline. Many professional traders prefer waiting for the data to reduce uncertainty. Use our AI Trading Bot to automate the process and avoid emotional mistakes.
Conclusion
The Gold price forecast May 11 2026 Asia open tilts bearish in the short term as $4,680 support is under threat. Key levels to watch: a break below $4,660 opens the door to $4,550, while a reclaim of $4,700 could lead to a test of $4,710 (20 EMA). Until the CPI data clears the air, patience is the best strategy. Let our AI Trading Bot trade the setup 24/7 with a proven 83% win rate, so you can stay ahead of the market without staring at the charts.
Trading Gold (XAU/USD) involves significant risk of loss. This content is for informational purposes only and does not constitute financial advice. Always conduct your own research and trade responsibly.