Gold Price Forecast Week May 9-15, 2026: $4,760 Resistance in Focus
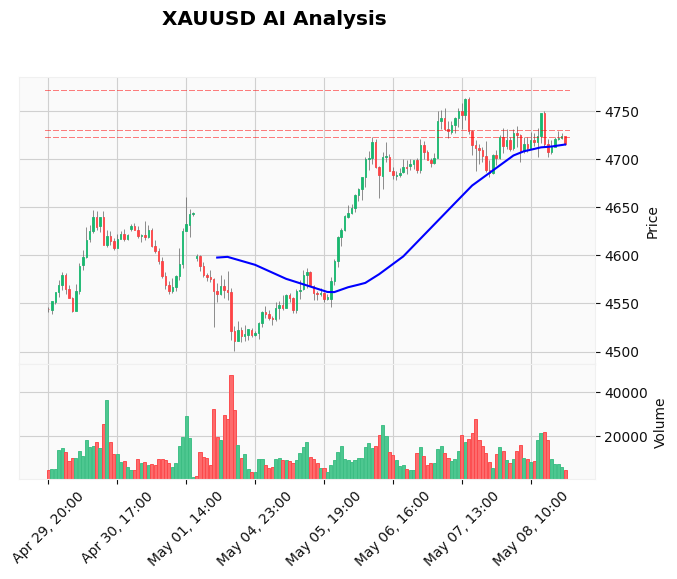
Gold marched higher last week, closing at $4,715.20 after a volatile range that swept from $4,500 to $4,764. The 2.2% weekly gain confirmed the bullish tilt that has dominated since the April breakout, but the price now sits at a critical inflection point. Bulls are defending the $4,700 support zone while bears eye a break below to trigger deeper profit-taking. If you want to trade these moves automatically, consider using our AI Trading Bot that follows real-time XAUUSD setups with an 83% win rate.
Last Week in Review
The week started with a sharp dip to $4,500.57, below the prior week's low, but buyers stepped in aggressively. A combination of safe-haven flows from renewed China-Taiwan rhetoric and persistent US dollar weakness fueled a rally that tested $4,764.87 on Wednesday. However, profit-taking ahead of the weekend pulled prices back to $4,715, closing near the weekly open of $4,613.75. The net result was a bullish engulfing week on the weekly chart, with a long lower wick – a classic sign of buying support at lower levels.
Key events included mixed US jobs data and ongoing central bank buying. The People’s Bank of China added another 8 tonnes to its reserves, while European ETF inflows hit a six-month high. Silver also caught a bid, climbing above $80, which often precedes aggressive gold buying.
Weekly Technical Outlook
On the weekly time frame, the trend is officially neutral, but the structure suggests a resumption of the uptrend if $4,700 holds. The Relative Strength Index sits at 51.70, right at the midline – no overbought pressure, room to run higher. The MACD line at -31.05 is above the signal line at -39.30, indicating bullish momentum is building despite the histogram still being negative. A positive crossover on the MACD would be a powerful confirmation.
Moving average stacking gives a mixed picture. The weekly EMA 20 at $4,674.29 is below the EMA 50 at $4,726.39 – a bearish cross that occurred weeks ago – but price is currently above the EMA 20 and trying to reclaim the EMA 50. A weekly close above $4,726 would flip the EMA structure back to bullish. Meanwhile, the EMA 200 at $4,346.23 is well below, confirming that the long-term trend is still up. The Bollinger Bands on weekly show a contraction after the wide range last week, suggesting a breakout in the coming days. The Average True Range of 114.82 remains elevated, so expect sharp intra‑week swings.
Support levels are well-defined. The first major support is $4,099.02, the deep weekly support from the TradingView data, but a more immediate floor exists at $4,400–4,402 (S2), which also coincides with the previous week's low and the 50‑day moving average on daily. Resistance is clear: $4,889.44 (R1) and then $5,419.15 (R2). The $4,760–4,765 zone acted as intra‑week resistance last week; a clean break above that opens the path toward $4,889.
Detailed Scenarios
Bullish Scenario: If price holds above $4,700 and breaks the $4,760 resistance, expect a quick move toward $4,889. This would require continued USD weakness and fresh safe‑haven buying. A weekly close above $4,726 (EMA 50) would confirm the bullish bias. Target then becomes $5,000 psychological.
Bearish Scenario: A break below $4,700 support, especially with a daily close under $4,670 (EMA 20), would signal a failed rally. In that case, gold could retest $4,500 and even the $4,400 support. The bearish case is reinforced by the neutral RSI – no extreme to force buyers back in – and a potential double‑top near $4,764.
Neutral Scenario: The most likely path is a consolidation between $4,700 and $4,760 for the first few days, then a breakout triggered by either a news event or a moving average cross. Such a range offers scalp opportunities for day traders but requires patience for swing setups.
Fundamental Outlook
The macroeconomic background remains supportive for gold. The overarching theme is safe‑haven demand coupled with inflation concerns. Rising tensions over China’s war rhetoric, as highlighted by Rabobank, have pushed Asian currencies lower and triggered gold buying in China and India. The People’s Bank of China continues to add to its reserves, and ETF inflows from Western investors are accelerating as real yields fall. The US dollar index remains under pressure after the Fed signalled a pause in rate hikes, and any further weakness in the dollar will be a tailwind for gold.
The top stories from the past week confirm this: Indonesia’s growth slowing, Brazil’s inflation shock, and a silver price surge above $80 all point to a reflation trade that benefits precious metals. The lack of high‑impact US data in the upcoming week means the market will trade off technical levels and geopolitical headlines.
If you want to automate your gold trades around these fundamentals, our News Trading Bot is designed to catch the volatility from headline releases without emotional bias.
Economic Calendar
| Date | Event | Impact | Previous | Forecast |
|---|---|---|---|---|
| May 11 | No high-impact USD events | Low | - | - |
| May 12 | No high-impact USD events | Low | - | - |
| May 13 | No high-impact USD events | Low | - | - |
| May 14 | No high-impact USD events | Low | - | - |
| May 15 | No high-impact USD events | Low | - | - |
The economic calendar shows no high‑impact US releases this week. While this might suggest low volatility, gold often moves on its own fundamentals – central bank policy expectations, geopolitical heat, and technical breakouts. The absence of data noise actually helps technical traders focus on pure price action.
Gold Trading Strategy This Week
Based on the AI Analysis Log, the management decision is to hold the existing BUY signal initiated at $4,715.0 with a stop loss at $4,650.0. This signal is still valid as price is exactly at the entry level. The bullish macro context supports holding. However, for new traders, here is a clear plan:
Swing Trade (multi‑day): Buy on a pullback to $4,700–4,710 zone with a stop loss at $4,650. First target: $4,760 (last week’s high), second target: $4,889. Risk‑reward: 1:2 for first target, 1:3 for second. Position size: 1% of account risk per trade.
Day Trade (intraday): Look for longs above $4,720 with a move through $4,740. Alternatively, if price breaks below $4,700 with volume, consider a short scalp toward $4,670 with a stop above $4,710. But given the bullish bias, short trades should be quick and tight.
This strategy works best when combined with our AI Trading Bot, which can execute these levels 24/7 without monitoring. For passive income, check out our Cloud Copy Trading service.
Risks to Watch
The biggest risk is a sudden shift in geopolitical sentiment – for example, a diplomatic breakthrough that reduces safe‑haven demand and triggers a sell‑off back to $4,500. Another risk is a sharp rise in the US dollar if the Fed unexpectedly pivots hawkish, though this is unlikely this week given the quiet calendar. Finally, a breakdown below $4,700 would invalidate the bullish scenario and could lead to a retest of $4,600.
Always adjust position sizes accordingly and never risk more than 2% of your account on any single trade. For reliable execution and low latency, use our Windows VPS for Gold trading.
Frequently Asked Questions
What is the gold price forecast for next week?
Our forecast expects gold to consolidate between $4,700 and $4,760 early in the week, with a bullish bias to test $4,760 and possibly $4,889 if $4,700 holds as support.
Where is the key support for gold this week?
The immediate support is $4,700, followed by $4,670 (EMA 20) and then the stronger $4,400 zone. A weekly close below $4,700 would shift the outlook bearish.
Will gold break $4,760 this week?
It is possible if the geopolitical environment remains tense and the US dollar stays weak. A break above $4,760 would likely target $4,889 next.
How does the US economic calendar affect gold this week?
There are no high‑impact USD events scheduled, so gold will be driven by technical patterns, central bank actions, and global news rather than US data releases.
What is the best trading strategy for gold this week?
Buying on dips near $4,700 with a stop loss at $4,650 and targeting $4,760/$4,889 offers a favorable risk‑reward ratio. For day traders, focus on intraday support at $4,710 and resistance at $4,740.
Conclusion
Gold enters the second week of May with a constructive technical backdrop and supportive fundamentals. The key level to watch is $4,700 – as long as it holds, the path toward $4,889 remains open. The quiet calendar actually favours technical traders looking for clean breakouts. Remember, patience pays in gold; let the market prove itself before committing. Our AI Trading Bot is ready to help you capture these moves automatically. Trade responsibly.
Risk Disclaimer: Trading Gold (XAU/USD) involves significant risk of loss. This content is for informational purposes only and does not constitute financial advice. Always conduct your own research and trade responsibly.