Gold is finding its footing at the start of the European session on Monday, with the XAU USD price movement May 11 London open showing a tentative bounce from the $4,650 support zone. After sliding to a fresh intraday low just below $4,650 during Asian hours, the precious metal has recovered to trade near $4,670 as of 07:05 UTC. The market remains in a tense consolidation range, trapped between a hawkish Federal Reserve narrative and simmering geopolitical tensions from the Iran conflict. For traders eyeing the London open, the key question is whether this bounce has legs or if the bearish fundamental backdrop will cap any upside ahead of Wednesday’s critical US CPI release.
Want to trade this precise Gold setup automatically? Our AI Trading Bot runs 24/7 on XAU/USD with an 83%+ win rate, catching entries just like this one.
Gold Market Overview
The broader market sentiment is cautious. The US Dollar Index remains bid above 105.50, supported by rising US Treasury yields as markets price in a higher probability of a Fed rate hike following the Iran-driven oil shock. Pimco’s CIO warned that the war makes rate cuts counter-productive and may bring hikes back on the table. Meanwhile, gold’s safe-haven appeal is partially offset by the dollar strength, resulting in a neutral-to-bearish short-term bias. The PBOC set a weaker USD/CNY fix at 6.8467 (vs. estimate 6.7988), adding further support to the greenback. On the geopolitical front, both the US and Iran rejected respective war-ending proposals over the weekend, maintaining a floor under gold prices. As an analyst, I see the market waiting for a catalyst—and that catalyst is Wednesday’s CPI report.
Technical Analysis
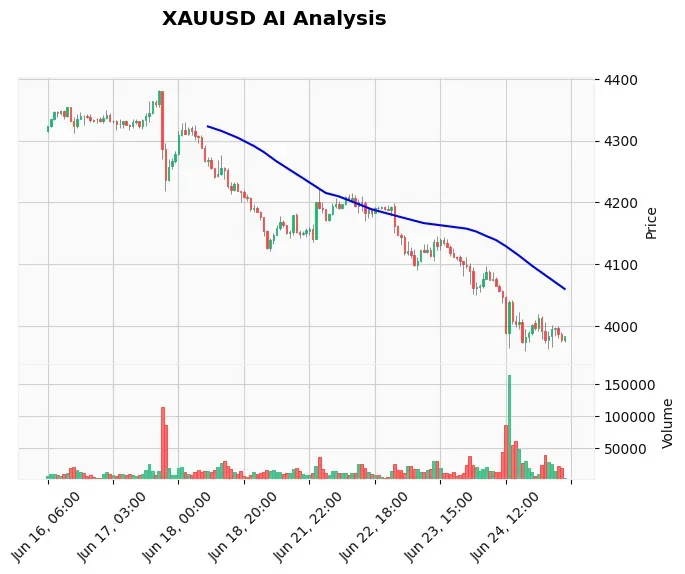
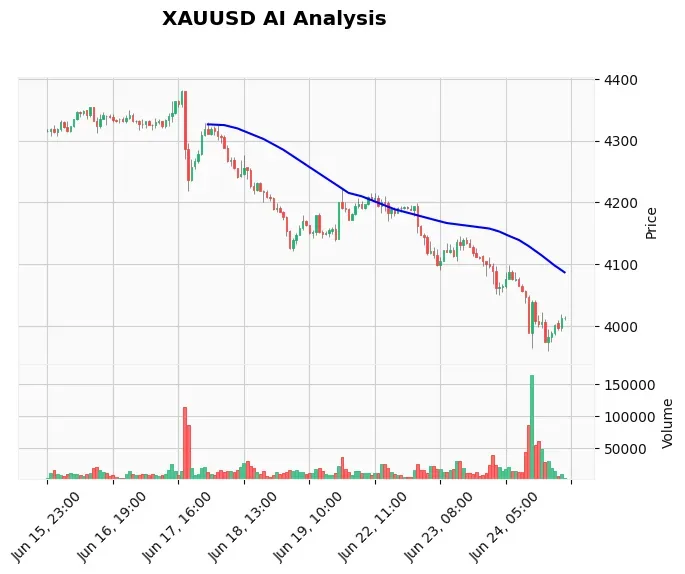
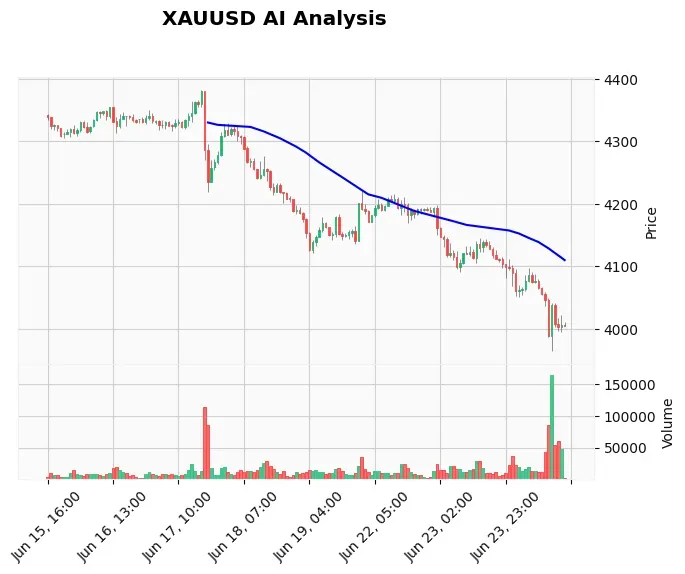
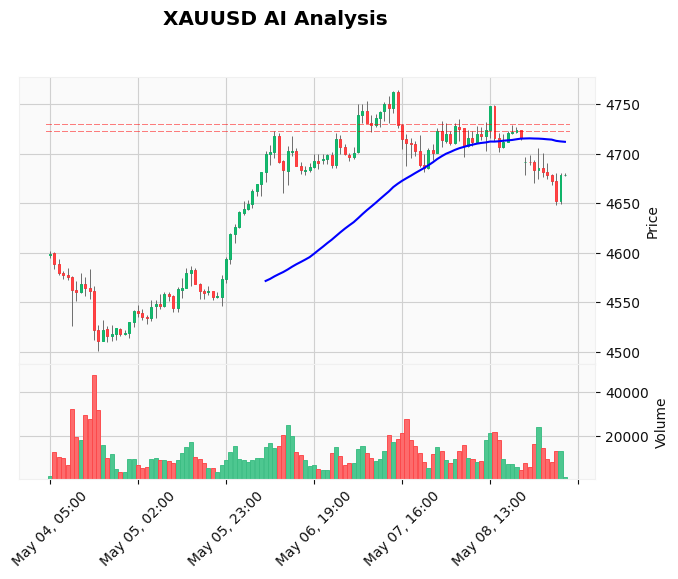
On the H1 chart, the XAU USD price movement May 11 London open is characterized by a bounce from the $4,650 support level, which aligns with the previous session’s low and a prior congestion zone. The RSI on the 15-minute timeframe is surging from oversold territory, currently at 39.65 on the hourly, indicating bullish momentum building. However, the EMA structure remains bearish: price is trading below the 20 EMA ($4,691) and 50 EMA ($4,695), while the 200 EMA sits at $4,663—just above current price. This suggests that while a short-term recovery is underway, the larger trend is still under pressure.
Key resistance levels are $4,700 (psychological and prior buy-limit zone) and $4,715 (pre-congestion high). Above that, the 20 EMA at $4,691 will be the first test. Support remains at $4,650, with a break below opening the door to $4,600. The MACD is still negative (-12.29, signal -8.13) but showing early signs of convergence. ATR of 20.9 indicates moderate volatility—enough for a 20-point move but not explosive. For detailed daily and weekly charts, our Gold technical analysis tools provide real-time updates.
Fundamental Drivers
The fundamental picture is dominated by two opposing forces. First, the geopolitical risk premium from the Iran conflict keeps a floor under gold. Safe-haven inflows into Hong Kong-listed Gold ETFs hit record highs in April, with China leading the buying spree. This supports the long-term bullish case for gold. Second, the macro backdrop is turning increasingly hawkish. Goldman Sachs has pushed its first Fed rate cut forecast to December 2026, and markets are now pricing in a 35% chance of a rate hike by September—up from near-zero a month ago. The Core CPI m/m forecast of 0.3% (vs. 0.2% previous) and the CPI y/y jump to 3.7% (from 3.3%) would confirm that inflation is re-accelerating, potentially triggering a sharp selloff in gold. For traders, the next 24 hours will see a mix of low-impact US data, but all eyes are on Wednesday. Our News Trading Bot is specifically designed to trade these high-impact events automatically.
Devil’s Advocate
The bullish momentum at the London open could easily be a dead cat bounce. If the $4,670 area fails to attract buyers and price reverses below $4,650, the next support is $4,600 and then $4,560. The daily trend is still bullish, but the short-term corrective phase could extend further if the dollar continues to strengthen. A break and close below $4,650 on the H1 would invalidate the bounce and signal that sellers are in control ahead of CPI. In that scenario, the best strategy is to wait for a deeper retracement before considering long entries.
Trading Strategy for This Session
For the European session, I recommend a cautious approach. The data shows a short-term buy-the-dip opportunity at $4,650 with a tight stop. Here is the setup:
- Entry zone: $4,655–$4,665 (current bounce zone)
- Stop loss: $4,625 (below recent low, allowing for ATR wiggle)
- Take profit 1: $4,695 (20 EMA / resistance)
- Take profit 2: $4,710 (50 EMA / prior resistance)
- Risk/Reward: 1:2 or better
This is a short-term scalping opportunity. If price cannot break above $4,670 within the next hour, consider reducing position size. For those who prefer a buy-and-hold strategy, the current bounce might be too early. I recommend using live Gold trading signals to get real-time updates on this and other setups.
Risk Management
Position sizing is critical here. Given the pending CPI event and the neutral trend, limit exposure to 0.5% of your account per trade. The risk of a sudden dollar rally or a geopolitical de-escalation (both unlikely but possible) could trigger a 30-point drop in minutes. Always use a stop loss. If the trade goes against you and hits the stop, do not revenge trade. Wait for price to retest support or for the CPI release to provide direction. As a rule, never risk more than 1% of your capital on any single setup.
Frequently Asked Questions
Q: What is the XAU USD price movement May 11 London open?
A: At the London open on May 11, gold is trading around $4,670, bouncing from a low of $4,650. The market is consolidating in a tight range ahead of Wednesday’s US CPI report. The bias is neutral with a bullish intraday bias.
Q: Is $4,650 a strong support for gold?
A: Yes, $4,650 has acted as a support zone in recent sessions. A break below could trigger a slide to $4,600. Historically, this level aligns with past congestion and the 200 EMA on daily charts.
Q: How will the US CPI affect gold prices?
A: The CPI release on Wednesday is the most important event this week. A higher-than-expected print (Core CPI 0.3%+ ) would strengthen the case for Fed rate hikes, pushing gold lower. A miss could trigger a sharp rally.
Q: Can I trade gold automatically with AI?
A: Yes. Our AI Trading Bot is fully automated and designed for XAU/USD. It uses multiple timeframe analysis and has an 83% win rate. You can run it on any VPS.
Conclusion
The European session is shaping up to be a battle between short-term momentum and fundamental headwinds. The XAU USD price movement May 11 London open shows a resilient bounce off $4,650, but without a catalyst, the upside may be capped at $4,700. The smart play is to trade the range with tight stops and scale down size until Wednesday’s CPI provides clear direction. For those who want to trade without screen time, let our AI Trading Bot handle the analysis and execution 24/7—join over 5,000 traders who trust our system.
Risk Disclaimer: Trading Gold (XAU/USD) involves significant risk of loss. This content is for informational purposes only and does not constitute financial advice. Always conduct your own research and trade responsibly.