How Institutional Traders Move Gold: A Complete Guide for Retail Traders
Every day, gold prices swing on what seems like random moves. But behind those candles, institutional traders — banks, hedge funds, commodity trading advisors — are executing massive orders that create the structure you see on your chart. Understanding how these players operate can transform your trading from guessing to following the smart money. In this guide, you'll learn the exact methods institutions use to move XAUUSD and how you can align your trades with theirs. If you want to automate this process, consider our AI Trading Bot that detects institutional footprints in real time.
What Does “Institutional Traders” Mean in Gold?
Institutional traders are entities that trade in large volumes — often millions of dollars per order. They include central banks (e.g., the People's Bank of China, the Federal Reserve), sovereign wealth funds, pension funds, and hedge funds. Unlike retail traders who typically use spot gold (XAUUSD) through brokers, institutions use futures (COMEX), over-the-counter forwards, options, and physical bullion. Their trades are massive enough to leave visible marks on price charts — support zones where they accumulate, resistance where they distribute, and liquidity gaps they chase. Recognizing these footprints is the core skill you need to develop.
Why It Matters for XAUUSD Traders
Retail traders often lose money because they trade against the institutional flow. When you buy at a breakout that immediately reverses, a big bank may have just sold into that breakout — distributing its long position to late buyers. By understanding where institutions are placing their orders, you can anticipate reversals and continuations that are not obvious to the crowd. For gold specifically, institutions watch the dollar, real yields, and geopolitical risk. Their reaction to data like NFP or CPI is often the real catalyst behind the move. We cover these events in our professional gold signals, where we highlight high-probability institutional setups.
How Institutional Traders Move Gold – Step by Step
Here is the process institutions follow from analysis to execution. Each step leaves a trace you can learn to read.
Step 1: Accumulation Phase
Before a major rally, institutions buy gradually over days or weeks. They do not want to push price up immediately because that would increase their average entry cost. Look for wide-ranging candles with long lower wicks (buying into dips) followed by small consolidation ranges. On the daily chart of gold in early May 2026, you can see this pattern around $2,370–$2,390 — price tested that zone multiple times, each time bouncing with increasing volume. That accumulation laid the foundation for the move to $2,450.
Step 2: Markup Phase
Once enough positions are built, institutions drive price higher by placing aggressive buy orders. This phase is often triggered by a news event that brings in retail buyers. The markup shows as strong bullish candles with above-average volume and a clean break of previous resistance. During this phase, you want to join the trend, not fight it. Use a trailing stop or move your stop to breakeven after a 1:1 risk-reward is achieved.
Step 3: Distribution Phase
At the top, institutions begin selling their positions to the late retail buyers. Signs of distribution include divergence on RSI, long upper wicks, and a cluster of small bearish candles after a strong rally. When gold recently tested $2,460, the RSI on the daily chart showed bearish divergence while price barely pushed higher before collapsing back. That is a classic distribution signature.
Step 4: Markdown Phase
After distribution, institutions may short or step aside as price falls. The markdown is sharp, often with gap downs or fast moves that hit stop-losses below support. The price then seeks new areas of accumulation at lower levels. Understanding this cycle helps you avoid buying at the top and selling at the bottom.
Common Mistakes Gold Traders Make When Following Institutions
Mistake 1: Confusing retail volume with institutional volume. Retail volume is small and scattered. Institutional volume shows as high volume at specific price levels, not over a wide range. Use volume profile to see where the big players are active.
Mistake 2: Acting on one candle. Institutions do not finish their accumulation in one bar. Wait for a series of wicks or a cluster of high-volume bars within a tight range before assuming absorption is complete.
Mistake 3: Ignoring the higher timeframe context. A 15-minute accumulation may be just a retracement on the daily. Always check the daily and 4-hour chart to see the broader institutional plan.
Mistake 4: Forgetting that institutions also trade the news. They create liquidity by pushing price into news releases. If the market is positioned heavily long, a bearish NFP surprise will trap retail buyers and benefit institutions that sold into that strength. Stay away from trading 15 minutes before and after high-impact news or use an automated tool like our News Trading Bot that trades the post-news reaction with strict risk management.
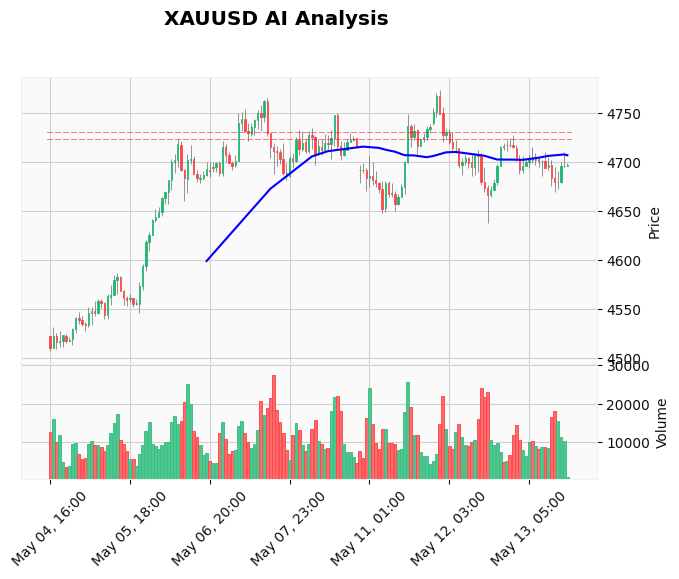
Real Example on XAUUSD Chart (May 2026)
Let’s apply this to a recent price move. Between April 28 and May 5, gold formed a narrow consolidation between $2,370 and $2,390 on the daily chart. Volume was elevated but price didn't break out — that is characteristic of accumulation. The RSI stayed above 40, showing underlying strength. On May 6, gold broke above $2,400 during a US non-farm payroll miss. The breakout candle had the highest volume in two weeks, confirming institutional buying. The move continued to $2,450 over the next three days. A retail trader who recognized the accumulation phase could have entered near $2,380 with a stop below $2,360 and targeted $2,450. That is a 1:3.5 risk-reward trade. Now, as of May 13, gold is testing $2,460 with bearish divergence — a possible distribution phase. A cautious trader would take profits and wait for a new accumulation zone to form. To follow these moves automatically, you can use our Price Action Pro EA, which spots order blocks and liquidity zones based on institutional concepts.
FAQ
How do I know if institutions are accumulating gold?
Look for tight price ranges on the daily or weekly chart with increasing volume at the bottom of the range. Long lower wicks and a series of higher lows also indicate accumulation. The Commitment of Traders (COT) report can confirm — rising speculative net long positions by commercial traders (hedge funds, banks) signal institutional buying.
What is the best timeframe to spot institutional activity in gold?
The daily and weekly timeframes give the clearest picture of institutional accumulation and distribution. The 4-hour chart can help you time entries after confirming the daily bias. Lower timeframes (15-minute, 1-hour) contain too much noise for institutional footprint detection.
Can retail traders really trade against institutions?
In most cases, no — you don't have the capital or information. However, you can trade in the same direction as institutions by identifying when they are active. That is the essence of ‘smart money’ trading. Avoid fading strong trends, as that is often where institutions are taking profits against retail overconfidence.
Do institutions use stop-loss hunts when trading gold?
Yes. Institutions often drive price to areas where many retail stops are placed — usually just below recent lows or above recent highs — and then reverse. This creates liquidity for their large orders. Look for sudden spikes with a short wick that quickly reverses. That is a classic stop hunt.
What tools help track institutional order flow in gold?
Volume profile, footprint charts (from platforms like NinjaTrader or Sierra Chart), the COT report, and cumulative delta analysis are the most common. For a simpler approach, you can use support/resistance from volume-weighted average price (VWAP) and track where price tests and reacts. Our technical analysis tools include VWAP and volume profile indicators for MT4/MT5.
Conclusion
Institutional traders are the primary force behind every major gold move. By learning to read their footprints — accumulation, markup, distribution, and markdown — you can avoid buying tops, selling bottoms, and being trapped by false breakouts. Start by identifying accumulation zones on the daily chart and use those as your high-probability entry areas. Combine this knowledge with sound risk management and you'll trade with the flow, not against it. For a fully automated approach, our AI Trading Bot processes institutional order flow and executes trades 24/7 on XAUUSD, built with the same principles you learned today.
Trading Gold (XAU/USD) involves significant risk of loss. This content is for informational purposes only and does not constitute financial advice. Always conduct your own research and trade responsibly.