Gold price today April 17 2026 Europe: $4,780 Pivot Holds the Key
The Gold price today April 17 2026 Europe is performing a delicate dance around a critical support zone. Trading near $4,784, XAU/USD is consolidating after failing to reclaim the $4,800 handle in the Asian session. For European traders, the immediate focus is the $4,780 confluence support. A firm hold here could reignite the bullish momentum and send gold probing towards $4,825. However, a failure at this juncture would signal deeper corrective risks. This session's price action will be dictated by whether bulls can defend this line in the sand. Want to trade this pivotal Gold setup on autopilot? Our AI Trading Bot executes 24/7 on XAU/USD, identifying key reversals like this with an 83%+ win rate.
Gold Market Overview
Gold sentiment entering the European session is cautiously neutral, reflecting a market caught between supportive macro fundamentals and near-term technical pressure. The price is trapped in a tight $4,778 to $4,795 range, hugging the lower boundary. The US Dollar Index (DXY) shows modest strength, which is capping gold's upside for now, but the haven bid remains intact beneath the surface. Geopolitical headlines surrounding US-Iran talks are being monitored, but the absence of fresh escalation has removed an immediate catalyst for a surge. The underlying theme remains stagflationary fears and persistent central bank demand, which are constructing a solid floor under gold prices. With no high-impact USD data scheduled for today, price action will likely be driven by technical flows and shifts in broader risk appetite.
Technical Analysis
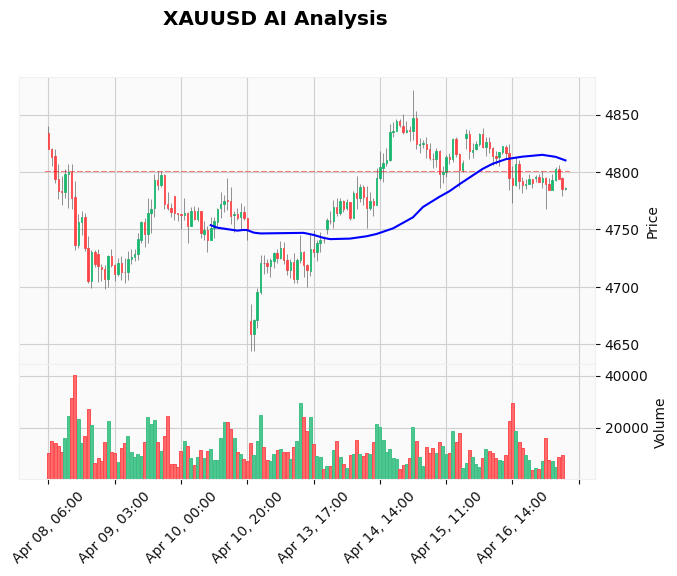
The technical picture presents a classic battle between short-term momentum and longer-term structure. On the hourly chart, price is testing a crucial support confluence between $4,770 and $4,780, aligning with the AI log's identified zone. The rejection from the $4,820-$4,825 area suggests a potential double-top pattern, but this bearish structure is only valid upon a decisive break below $4,770. The TradingView data confirms the struggle: price is currently below the 20-day EMA at $4,795.77 and the 50-day EMA at $4,799.21, indicating short-term bearish pressure. However, it remains comfortably above the 200-day EMA at $4,758.13, affirming the primary uptrend.
The RSI reading of 42.30 shows bearish momentum but is not yet oversold, leaving room for a further dip or a stabilization. The MACD histogram is negative (-5.36), though the signal line is converging, hinting at slowing downward momentum. Key levels to watch are clear: immediate resistance sits at $4,795 (session high/20 EMA) and then the more significant $4,838.31 (R1). On the downside, a break below $4,770 opens the path toward $4,698.47 (S2). The Average True Range (ATR) of 15.14 points to moderate intraday volatility, typical for a European session.
Fundamental Drivers
Two primary fundamental pillars are supporting gold today. First, the lingering geopolitical risk premium from the Iran conflict continues to provide a safe-haven bid, preventing aggressive selling. Second, and more structurally important, are the persistent stagflation narratives. Recent Federal Reserve research confirming that past tariffs contributed to inflation, coupled with ongoing concerns about growth, keeps gold attractive as a hedge. Furthermore, the People's Bank of China (PBOC) set a weaker-than-expected USD/CNY reference rate today. A softer yuan often boosts local gold demand in China, the world's largest consumer, providing an under-the-radar supportive factor. For traders looking to capitalize on these fundamental shifts as they happen, our News Trading Bot automates entries based on high-impact news events and central bank decisions.
Devil's Advocate: The Bear Case
While the setup favors a bounce, a clear-eyed trader must acknowledge the risks. The failure at $4,825 and the formation of a lower high on the intraday charts are technically concerning. If the $4,780-$4,770 support cluster gives way, it would confirm the double-top pattern and trigger stop-losses from recent dip-buyers. This could catalyze a swift move down to test the $4,700 area. Fundamentally, any tangible progress in US-Iran peace talks or a sharp, coordinated hawkish shift from global central banks could quickly erode the haven bid. The key level that invalidates the immediate bullish dip-buying thesis is a sustained break and close below $4,765.
Trading Strategy for This Session
For the European session, the strategy revolves around the $4,780 pivot. The higher-timeframe trend is bullish, and fundamentals are supportive, making a bounce from support the higher-probability play.
- Bias: Cautiously Bullish (conditional on $4,780 hold).
- Entry Zone: $4,775 - $4,780. This aligns with the AI log's suggested buy limit at $4,775 to capture a better price on the dip.
- Stop Loss: $4,765 (just below the key support confluence).
- Take Profit Targets: TP1 at $4,800 (psychological resistance/session high), TP2 at $4,815, and final TP at $4,825 (recent swing high).
This offers a favorable risk-reward ratio. For traders who prefer a rules-based approach to such support/resistance plays, our Price Action Pro EA specializes in identifying and trading these precise SMC-based setups on XAU/USD automatically.
Risk Management
Always risk only 1-2% of your account capital on any single trade. With a 10-point stop loss ($4,775 to $4,765), adjust your position size accordingly. The primary target at $4,800 offers a 1:2.5 risk-reward (25-point profit vs 10-point risk). If price immediately breaks below $4,780 without offering an entry, do not chase. Wait for either a clear rejection candle to form above $4,770 or for a pullback after a breakdown to consider a short trade toward $4,700. Discipline in waiting for your predefined level is more important than being in the market.
FAQ
Q: What is the current Gold price in Europe?
A: As of the European session open on April 17, 2026, Gold (XAU/USD) is trading around $4,784. It is currently testing a key support area between $4,780 and $4,770.
Q: Why is Gold price going down today?
A: Gold is experiencing mild downward pressure due to a modestly stronger US Dollar and a technical rejection from the $4,825 resistance area. Short-term momentum has turned bearish, but the larger trend remains intact.
Q: What is the key level for Gold today?
A: The most critical level is the $4,780 support zone. A bounce from here targets $4,800 and $4,825. A break below it opens the door for a move down to $4,700.
Q: What is a good Gold trading setup for April 17?
A: A potential setup is to look for a buy opportunity near $4,775-$4,780, with a stop loss below $4,765, targeting a move back to $4,800-$4,825. This plays for a bounce within the ongoing uptrend.
Conclusion
The Gold price today April 17 2026 Europe sits at an inflection point. The battle lines are drawn at $4,780. Bullish macro fundamentals and the primary uptrend argue for a defense of this level and a subsequent push higher. However, traders must respect the near-term bearish momentum and have a plan for a breakdown. The most prudent approach is to wait for price to show its hand at this pivotal support before committing capital. For those who want to remove the emotion and execute this high-probability, level-based strategy consistently, consider letting our best-selling Gold trading bot handle the entries, stops, and targets based on real-time algorithms, freeing you to focus on analysis.
Risk Disclaimer: Trading Gold (XAU/USD) involves significant risk of loss. This content is for informational purposes only and does not constitute financial advice. Always conduct your own research and trade responsibly. Past performance of any trading system is not indicative of future results.