XAUUSD European Session Analysis June 03: Bears Test $4,447
Gold is sliding into the European session as bears tighten their grip, driving XAU/USD toward the critical $4,447 support after a weak Asian open. Prices dipped below $4,460 overnight and now hover around $4,453, with momentum clearly favouring the downside. This XAUUSD European session analysis for June 03 shows sellers are firmly in control, and a break of this near-term floor could trigger a quick drop toward the 200-day SMA near $4,430. For traders who want to ride that move automatically, our AI Trading Bot scans XAU/USD 24/7 and executes with proven precision.
Gold Market Overview
Sentiment across the gold market remains decisively bearish as a stronger US dollar continues to weigh on the precious metal. The DXY is extending its recovery ahead of today’s high‑impact US data, while oil’s relentless surge is adding fuel to inflation fears, pushing central bank hawkishness further into focus. Market intelligence from FXStreet confirms gold “languishes near weekly low,” and Investing.com headlines point to persistent geopolitical tensions that, for now, are failing to ignite safe‑haven bids. Instead, traders are pricing in a higher‑for‑longer Fed stance, which keeps the dollar bid and strips gold of its appeal. The upcoming ADP Non‑Farm Employment Change (forecast 118K) and ISM Services PMI (53.7) are both expected to show modest improvement, reinforcing the USD and applying additional pressure on XAU/USD before the New York open.
Technical Analysis
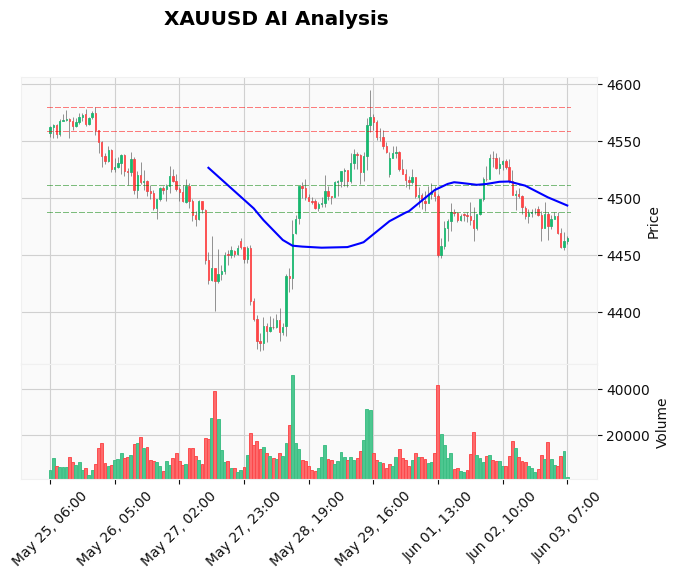
The daily and intraday charts paint a grim picture for gold bulls. Price is trading well below all key exponential moving averages – the 20 EMA at 4481.54, the 50 EMA at 4492.17, and the 200 EMA at 4509.93 – confirming a strong bearish alignment. The RSI sits at 33.44, still in bearish territory but not yet oversold, leaving room for further downside. The MACD histogram is deeply negative at -11.21, with the signal line at -7.71, and the gap is widening, indicating accelerating momentum. The ATR of 15.68 suggests that a daily range of around 15‑20 points is typical, making a move to the next support level entirely achievable within this session.
Immediate support rests at the webhook‑derived S1 of 4447.55, a line that was tested intraday and held on the first attempt. Below that, the 200‑day SMA near 4425 and the analyst‑confirmed 4430 cluster form a robust support zone. On the upside, the 4465 area (the prior entry point) now acts as resistance, followed by the recent swing high at 4480. While the webhook lists far‑off resistances at 4580‑4595, those are irrelevant for today’s European playbook. The attached chart highlights a textbook bearish flag breakdown on the H1 timeframe, underscoring the path of least resistance being lower.
Fundamental Drivers
Today’s macro calendar is loaded with USD‑positive event risk. ADP payrolls are due in just over four hours, followed by the ISM Services PMI two hours later. Both indicators are forecast to improve, and strong readings will cement hawkish expectations, giving the dollar another leg up. Higher oil prices – driven by fresh Middle East hostilities – are raising inflation expectations and reducing the odds of any near‑term rate cuts, a double blow for gold. Central bank actions are also stacking against the metal: news from India confirms the Reserve Bank of India has been a net seller of gold, adding to physical supply and dampening sentiment. To stay ahead of these data releases and trade the news automatically, many traders rely on our News Trading Bot, which executes XAU/USD positions on high‑impact events in milliseconds.
Devil’s Advocate
The bearish case is strong, but it is not bulletproof. If ADP figures come in below the 118K forecast, or if the ISM Services index unexpectedly misses, the US dollar could reverse sharply, sparking a short‑covering rally in gold. An escalation in geopolitical tensions – beyond the current oil‑price reaction – could also bring safe‑haven flows back into XAU/USD, forcing a move above the 4465 resistance. A close back above the 20 EMA at 4481 would invalidate the immediate downside bias and target the 4480 swing high. This is why the AI Analysis Log’s stop loss at 4480 is placed exactly at that key level, guarding against a false breakdown.
Trading Strategy for This Session
The AI‑driven short position set earlier (entry 4465, stop 4480, target 4430) remains open and is already showing a small profit. Sellers can look to add to this position on any retest of the 4465 resistance – now a solid ceiling – or wait for a confirmed break below the 4452 session low. A pullback to 4460‑4465 offers an optimal entry with the same stop at 4480 and the first take‑profit at 4430, just above the 200‑day SMA. The risk‑reward profile is attractive at roughly 1:2.3. For traders who prefer automated execution, the Price Action Pro EA can manage this setup on MT4/MT5, capturing these swing trades without manual intervention.
Risk Management
With the ATR at 15.68, the 15‑point stop from 4465 to 4480 sits within one average daily range, making it a logical but tight buffer. Traders should risk no more than 1‑2% of their account on this trade. If the price closes above 4480 on the H1 timeframe, it is wise to cut losses. Conversely, a swift move to 4430 should see partial profits taken, with the remainder trailing to lock in gains. Running an automated system on a Windows VPS ensures the strategy runs 24/7 without interruption, especially critical during news spikes.
FAQ
Q: What is the gold price forecast for today June 3?
A: Our XAUUSD European session analysis sees bears targeting the $4,447 support, with a break likely pushing prices toward $4,430. The bearish momentum is driven by a strong dollar and hawkish Fed expectations ahead of key US data.
Q: Why is gold falling today?
A: A combination of a firmer US dollar, rising oil prices fuelling inflation and rate‑hike fears, and central bank selling (notably the RBI) is weighing on gold. Geopolitical tensions have not yet triggered safe‑haven demand.
Q: What are the key support levels for XAUUSD right now?
A: Immediate support is at $4,447, followed by the 200‑day SMA around $4,425 and the psychological $4,430 zone. A breakdown below $4,447 would open the door to $4,430 and potentially $4,366.
Q: How does the US ADP report affect gold?
A: A stronger ADP reading (above 118K) suggests a resilient labour market, boosting the US dollar and increasing the likelihood of further Federal Reserve tightening. This typically pressures gold lower by raising the opportunity cost of holding the non‑yielding metal.
Q: Should I sell gold now?
A: With price already at session lows, selling immediately carries higher risk. A pullback to the $4,460‑$4,465 resistance zone offers a more favourable entry. Wait for a retest or a clear break of $4,447 before committing fresh capital.
Conclusion
The European session has handed control to gold bears, with the $4,447 support line the last stand before a much deeper correction. Strong technical signals, a supportive fundamental backdrop, and a loaded US data calendar all point to further downside. The key level to watch is 4465 on any bounce – holding below keeps the pressure intact. As the day unfolds, the ADP and ISM reports will likely be the final catalysts. For a hands‑off approach, our AI Trading Bot leads the pack – mirror its performance through Cloud Copy Trading and let the algorithms do the heavy lifting while you focus on the bigger picture.
Trading Gold (XAU/USD) involves significant risk of loss. This content is for informational purposes only and does not constitute financial advice. Always conduct your own research and trade responsibly.