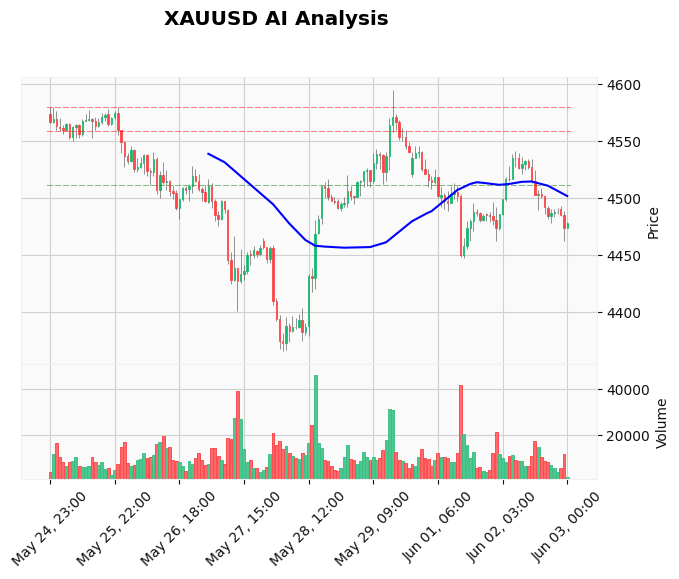
Gold Trading Setup June 03 Asia: Bearish Flag Hints at $4,450 Break
Gold is clinging to an overnight bounce in early Asian trade, but the Gold trading setup June 03 Asia session reveals a classic bearish flag pattern that puts the $4,450 support zone squarely in focus. XAUUSD closed Tuesday near $4,486 after a sharp intraday push from $4,474, yet the rally is running out of steam beneath the $4,500 psychological barrier. With the US Dollar regaining ground on hawkish Fed bets and strong US data expectations, the path of least resistance remains lower. Traders who recognize this corrective structure will find a high-probability opportunity to join the prevailing downtrend. If you want to execute this setup without staring at charts, our AI Trading Bot identifies bearish flag failures and manages risk automatically on XAUUSD.
Gold Market Overview – Asian Session
An air of caution dominates the Asian open as gold prices hover around $4,486, essentially flat from the New York close. The Dollar Index is holding firm above 104.50, fueled by the US-Iran diplomatic impasse and fresh fears that a resurgence in oil prices will keep the Fed on an aggressive tightening path. Treasury yields edged higher in the US session, and the 10-year note is threatening to retest the 4.45% area—a headwind for non-yielding gold.
Physical market flows add an extra layer of pressure. Reports that the Reserve Bank of India sold around $12 billion in gold to defend the rupee highlight how central bank selling, not buying, can suddenly emerge when dollar liquidity tightens. That dynamic flips the “central bank demand” narrative on its head. Meanwhile, China’s onshore gold premium has narrowed, signalling tamer consumption. For the Asian session, the macro theme is clear: a resilient US economy, sticky inflation, and a strong greenback are overshadowing any geopolitical safe-haven bid.
Technical Analysis – Key Levels and Structure
The hourly chart paints a bearish picture despite the bounce from $4,474. Price remains trapped below the 20, 50, and 200-period EMAs, which stand at $4,496, $4,499, and $4,512 respectively. This stacked alignment confirms a bearish moving average bias. The MACD histogram has inched back above its signal line, but both remain deep in negative territory, pointing to a weak retracement rather than a reversal. RSI at 43.24 is still leaning bearish and hasn’t reached overbought territory on this bounce.
Most importantly, the price action since Monday’s drop has carved out a textbook bearish flag. The pole extends from the $4,595 highs to the $4,447.55 support pocket, and the flag itself is a narrow upward channel that’s pressing against the $4,500–$4,506 resistance zone. A rejection from that area, combined with a break below the flag’s lower trendline near $4,475, would confirm the pattern and open the door back to $4,447.55, where initial support lies. Below there, the next meaningful downside target is the $4,366.29 zone—a level that aligns with the March swing lows. On the upside, a surprise move above $4,520 would invalidate the flag and shift short-term control to buyers.
Fundamental Drivers – Why the USD Keeps Winning
Gold’s struggle is largely a dollar story. The US-Iran negotiations have stalled, raising the spectre of renewed energy-driven inflation. Oil prices jumped again overnight, and markets know the Fed will interpret higher energy costs as a reason to keep rates higher for longer. ADP Non-Farm Employment Change and ISM Services PMI are on deck in roughly 11 and 13 hours, respectively, and both are forecast to beat prior readings. A combined beat would only strengthen the dollar’s hand and crush any remaining gold bids.
Geopolitically, the Israel-Hezbollah ceasefire provided only a fleeting bid to gold, and the lack of progress with Iran is, counterintuitively, hurting the metal because it reinforces the “higher-for-longer” rate narrative. Gold traditionally loves inflation, but not when it forces the Fed to tighten into a slowing economy. Until the macro backdrop shifts, every bounce is a selling opportunity. Our News Trading Bot is built to capture precisely these data-driven USD spikes that punish XAUUSD longs.
Devil’s Advocate – What Could Go Wrong for Bears
The bearish thesis hinges on the flag breakdown. If the flag morphs into a broader basing pattern, a break above $4,520 would force bears to cover and could trigger a run toward the descending 200-EMA near $4,512. Such a move would expose the $4,580–$4,595 resistance area and put the daily trend under scrutiny. Also, if US data later today unexpectedly miss, the dollar could retreat rapidly, lifting gold. The safe-haven bid remains a wildcard; an overnight escalation in the Middle East could spike prices past $4,500 before US traders even wake up. Traders must keep position sizes small and wait for the level-based trigger, not just the narrative.
Trading Strategy for This Session
For the Asian session, the plan is to sell into strength below $4,500 with a trigger on a break of the flag support. A sell order around $4,490–$4,495, with confirmation when price slips back below $4,475, offers a solid risk-reward setup. The stop loss goes at $4,508, just above the flag top and the intraday swing high. The first take-profit target sits at $4,455, and a more aggressive runner can be taken at $4,425. This gives a risk-reward ratio of approximately 1:2.5. If volatility stalls, traders can wait for the European open to follow through. To automate this exact logic, our Price Action Pro EA can detect bearish flags on XAUUSD and manage entries precisely as described.
Risk Management – Protecting Capital in a Volatile Corridor
Gold’s Average True Range of 15.15 points means daily swings of over $15 are normal, so a $18 stop loss from $4,490 to $4,508 gives the market room to breathe while keeping losses contained. Position size should not exceed 1–2% of account capital per trade. If the trade hits the first target, move the stop to breakeven to lock in a risk-free runner. Avoid adding to a losing short if the price retests $4,500; failure there would signal a pattern change and warrant a complete exit rather than doubling down.
FAQ – Gold Trading Setup June 03 Asia
What is the key level for gold today?
The $4,500 resistance zone is the line in the sand for the Asian session. A rejection here keeps the bear flag intact and points to $4,447 support. A 1-hour close above $4,520 would force a re-evaluation of the downtrend.
Why is gold falling despite geopolitical tensions?
Geopolitical flare-ups are boosting the US Dollar and oil prices, which feeds inflation fears and, in turn, hawkish Fed expectations. The resulting stronger dollar and rising real yields are weighing on gold, overriding the typical safe-haven bid.
What time are the US data releases that could move gold?
The ADP Non-Farm Employment Change is due at around 12:15 GMT, and the ISM Services PMI follows at 14:00 GMT. Both can cause sharp USD-gold reversals, so reduce exposure or tighten stops ahead of those events.
Is this a good time to buy gold?
Not yet. The daily trend remains firmly lower, and the bearish flag suggests the correction will likely fail. Buyers should wait for a confirmed higher low above $4,520 or a double-bottom pattern before switching from short to long.
Conclusion
The Asian session presents a classic fade-the-bounce opportunity. Gold’s bear flag is well-structured, and the fundamental backdrop—hawkish Fed, strong USD, central bank selling—gives sellers the edge. As long as $4,500 cap holds, the market will keep drifting toward $4,445 and potentially $4,425. Patience is key: wait for the flag breakdown confirmation, not the first tick of weakness. When you’re ready to trade while you sleep, let our AI Trading Bot handle entry triggers and stop levels automatically, delivering consistent short trades without emotion.
Trading Gold (XAU/USD) involves significant risk of loss. This content is for informational purposes only and does not constitute financial advice. Always conduct your own research and trade responsibly.