
Gold Holds $3,567 as Bears Eye $3,514 Breakdown
The Gold price November 20 2026 New York session opens with XAU/USD pinned near $3,572, holding the $3,567 VWAP after a week that has erased roughly 8% of value and dragged bullion to a 15-month low. Sellers broke $3,550 in Asian trade, price printed a session low at $3,552.83, and the bounce that followed has stalled rather than reversed. The H1 EMA stack is short, ADX reads 54.31, and the nearest structural support sits 651 pips below at $3,514.26. This is a market where the trend is clear but the entry is not.
Context matters for how you read the tape. Gold opened the day at $3,625.45 against a weekly open of $3,883.89, so the entire session is being fought out more than $250 below where the week began. The prior day low at $3,620.13 now sits overhead as resistance rather than a floor, and the daily close near $3,572.29 confirms that buyers have not reclaimed anything of substance. With no high-impact USD data due in the next two hours, the American session will be decided by positioning, stop runs and the willingness of shorts to take profit into an oversold higher-timeframe reading.
Want to trade this Gold setup automatically? Our AI Trading Bot runs 24/7 on XAU/USD with an 83%+ win rate.
Gold Market Overview
Sentiment is decisively bearish and the tape shows it. Gold opened the day at $3,625.45, well under the weekly open of $3,883.89, and has spent the session carving lower highs beneath the prior day low of $3,620.13. The daily close near $3,572.29 sits below every meaningful moving average on the higher timeframes: D1 EMA50 at $4,049.33 and D1 EMA200 at $4,217.49 are now distant overhead supply, not support.
The macro theme driving this move is a repricing of Fed policy. Rate-hike bets have returned to the front of the curve, and that repricing has pulled real yields higher and stripped Gold of its safe-haven bid. Headlines from FXStreet and Investing.com describe forced selling and capitulation, with one report calling this the worst week since March. The dollar backdrop and the unwind of the safe-haven trade are doing the heavy lifting here, not a single data print.
There are no high-impact USD events inside the next two hours, so the American session is likely to be driven by positioning and stop flows rather than a calendar catalyst. That matters for how you size a trade today: without a scheduled event to force a repricing, moves tend to grind and fade rather than trend cleanly.
Technical Analysis
The H1 chart is a textbook downtrend. Price at $3,572.01 sits below EMA20 at $3,598.12, EMA50 at $3,664.85, and EMA200 at $3,827.54, with the averages fanned in the correct bearish order. ADX at 54.31 with DI- at 28.36 against DI+ at 9.68 confirms trend strength, not chop. Structure is lower highs and lower lows, and the nearest swing high above at $3,595.29 has been tested four times, making it the first real ceiling.
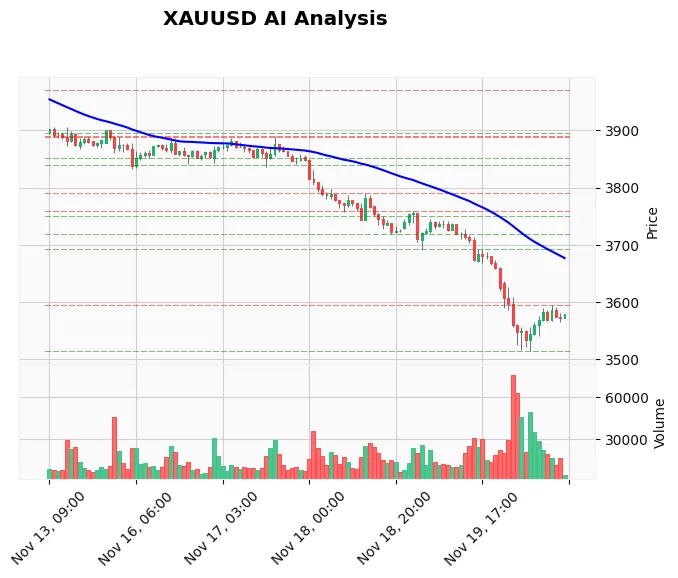
Momentum is where the picture complicates. RSI on H1 reads 35.84, off oversold but not recovered. Stochastic sits at 46.71/43.76 and MACD is negative at -33.6564 with a signal line at -39.4334, producing a positive histogram of 5.7770. That histogram is the first sign of fading downside pressure. On the higher timeframes the oversold condition is extreme: H4 RSI 22.15 and D1 RSI 24.40. ATR at 26.51 tells you the daily range is compressed relative to the week's violence, so expect smaller candles unless a level breaks.
Support is thin. S1 sits at $3,567.13, essentially where price is trading, and S2 at $3,514.36 lines up with the swing low at $3,514.26. Below that there is a structural void. Resistance above is $3,595.29 first, then $3,693.27 and $3,719.72, both broken support now acting as supply.
Fundamental Drivers
The dominant fundamental is the Fed repricing. Rate-hike expectations have climbed and that has lifted the opportunity cost of holding a non-yielding asset, which is the cleanest explanation for a 15-month low. Forced and capitulation selling has amplified the move, and when positioning unwinds this violently, price often overshoots before it stabilizes. The absence of a scheduled USD event today means the market is trading the residue of this week's repricing rather than anticipating a new one.
The one bullish wildcard is geopolitical. Reports that the Trump administration is considering strikes on Iran have surfaced, and a durable US-Iran resolution is being discussed in the same breath. That is a two-sided risk: escalation would revive the safe-haven bid, while de-escalation removes the last support for Gold. If you trade headlines rather than charts, an automated Gold news bot can execute the reaction without you watching every wire.
Devil's Advocate
The bear case is crowded. Both the technical and fundamental pillars agree, and that agreement is exactly when a market is most vulnerable to a squeeze. H4 RSI at 22.15 and D1 RSI at 24.40 are deeply oversold, and M15 momentum is already turning up. A reclaim of $3,595.29 would invalidate the immediate bearish structure and open a run at $3,620.13, the prior day low. If price closes an H1 candle above $3,595.29, the short thesis from here is dead and the oversold bounce is in control.
There is a second layer to the squeeze risk. The MACD histogram at +5.7770 is already positive while price makes lower lows, a mild bullish divergence that often precedes a sharp counter-trend leg. Add the compressed ATR of 26.51 and you have the ingredients for a stop run: shorts stacked between $3,567 and $3,552 have their exits clustered just above $3,595.29, and a push through that level would force them to buy back into thin supply. The invalidation is clean — one H1 close above $3,595.29 — and the first objective of any bounce is $3,620.13, with $3,693.27 the stretch target if the prior day low gives way.
Trading Strategy for This Session
The honest read is that a fresh short at $3,572 has poor reward-to-risk. Resistance is only about 159 pips above at $3,595.29, while the target at $3,514.26 is 651 pips away but requires price to break through deeply oversold higher-timeframe conditions first. The better structure is to sell a bounce into $3,590-$3,595 with a stop above $3,620.13 and a first target at $3,567.13, then $3,514.26. Alternatively, wait for an H1 close below $3,567.13 to confirm the breakdown and enter on the retest.
Work the numbers before you click. A short from $3,592 with a stop at $3,622 risks 30 dollars to make 25 to the first target at $3,567.13 — under 1:1, which is why the first target should be treated as a partial, not the whole trade. The full 651-pip run to $3,514.26 is what pays, and it only becomes live if $3,567.13 closes decisively. On the other side, a counter-trend long taken at $3,567.13 with a stop below the session low at $3,552.83 risks roughly 14 dollars against a 28-dollar move to $3,595.29, a clean 1:2 — but only if you enter at support, not after price has already run.
Three rules keep this session clean. First, do not short the middle of the range between $3,567 and $3,595; that is where stops get hunted in both directions. Second, treat $3,567.13 as the pivot — above it the bounce has room, below it the breakdown is in motion. Third, if price breaks $3,514.26 and snaps back above it within two H1 candles, that is a failed breakdown and a signal to stand aside rather than chase. The level does the work; your job is to wait for it.
If you would rather let a system handle the execution, our SMC-powered Gold EA reads structure and liquidity the same way this analysis does.
Risk Management
Size for the oversold bounce, not for the trend. With ATR at 26.51 on H1, a stop of 25-30 dollars is the minimum that survives normal noise, which means position size must come down accordingly. Risk no more than 1% of account equity on any single entry. If price closes above $3,595.29, exit the short without argument. If price breaks $3,514.26 and snaps back above it within two candles, that is a failed breakdown and a reason to stand aside rather than add.
Run the arithmetic on a $10,000 account. A 1% risk is $100, and a 30-dollar stop on XAU/USD means roughly 0.03 lots — small enough that a normal 26-dollar ATR swing does not force you out. The common mistake is sizing to the 651-pip target instead of the 30-dollar stop: a trader who risks $300 on the same stop is carrying 3% on one idea in a market that has already moved 8% in a week, and two losses in a row would take a sixth of the account. Cap total open risk across Gold positions at 2%, and if the trade fails at $3,595.29, take the loss, log it, and wait for the next level rather than re-entering in the same direction out of frustration.
FAQ
Is Gold going to fall below $3,500 today?
A break of $3,514.26 is the trigger, and below that the structural void opens the door to $3,500. The probability is moderate rather than high because H4 and D1 RSI are deeply oversold and M15 momentum is turning up. Watch the H1 close, not the wick.
What is the key resistance for the New York session?
$3,595.29 is the first level, tested four times on H1. Above it, $3,620.13 is the prior day low and the level that would confirm a bounce. A close above $3,595.29 invalidates the immediate bearish structure.
Why is Gold at a 15-month low?
Fed rate-hike bets have repriced higher, raising the opportunity cost of holding Gold, and forced selling has amplified the move. The safe-haven trade has unwound, and headlines describe capitulation conditions. The week is down roughly 8%.
Should I buy the oversold bounce?
Only with a defined stop below $3,552.83 and a target at $3,595.29. The trend is down on every timeframe, so a bounce trade is counter-trend and should be sized smaller than a trend trade. The reward-to-risk is acceptable only if you enter near support, not after a 40-dollar rally.
Conclusion
Gold holds $3,567 into the New York session with the trend firmly down and the nearest real support at $3,514.26. The tension is between a strong, established downtrend and deeply oversold higher-timeframe momentum, which makes chasing the short here a poor trade. The level that matters is $3,595.29: below it, bears remain in control and $3,514.26 is the target; above it, the bounce takes over and $3,620.13 comes into play. Trade the reaction at the level, not the middle of the range.
If you want this level-by-level discipline applied automatically, the best-selling Gold trading bot manages entries, stops and targets around structure in real time.
Trading Gold (XAU/USD) involves significant risk of loss. This content is for informational purposes only and does not constitute financial advice. Always conduct your own research and trade responsibly.