
Gold Momentum Builds, $3,585 Next Target
The Gold price forecast November 20 2026 Asia open lands on a market that has already broken the floor traders spent weeks defending. XAU/USD printed a 14-month low at $3,585.68 overnight and closed the H1 candle at $3,597.12, down another 0.28% as the Asian session takes over. The nearest resistance sits 959 pips above at $3,693.27, and there is no structural support left beneath current price.
This is not a market searching for direction. It is a market that has already chosen one and is now testing how far the sellers are willing to press before exhaustion forces a pause. The H1 EMA stack is fully bearish, ADX reads 46 with the negative directional index at 39.22 against a positive index of just 5.20, and momentum indicators are pinned in territory rarely visited. If you want to trade this kind of one-sided tape without sitting at the screen through every candle, our AI Trading Bot runs the same EMA-stack and ADX logic on XAU/USD around the clock.
Gold Market Overview
The macro backdrop is doing the heavy lifting for sellers. Gold has fallen to a 14-month low below $3,650 on hawkish Federal Reserve signals, and markets now price roughly a 95% chance of a quarter-point hike in December. JPMorgan sees three straight hikes ahead, Barclays notes that back-to-back moves give the dollar staying power, and Societe Generale's technical desk has flagged deeper downside targets after Gold failed to hold its 50-day moving average.
The dollar sits at a 19-month high, and that relationship is the single most important variable for XAU/USD right now. Every basis point of additional hike pricing lifts the greenback and drains the appeal of a non-yielding metal. There are no high-impact USD events scheduled within the next two hours, so the Asian session will trade on positioning and technical flow rather than fresh data.
One counterweight deserves mention. UBS has upgraded Gold and still carries a $5,000 longer-term target, arguing that buyers at these levels are being handed a rare entry. That view does not change the near-term flow, but it explains why the downside may become choppy rather than linear. The daily close at $3,597.17 sits far below the D1 EMA50 at $4,050.30 and the EMA200 at $4,217.74, so the macro trend remains decisively lower.
Technical Analysis
The H1 chart tells a clean story of lower highs and lower lows. Price at $3,597.12 trades well beneath the EMA20 at $3,680.94, the EMA50 at $3,733.06, and the EMA200 at $3,864.17, with the entire stack fanned in bearish order. ADX at 46.01 confirms a strong established trend rather than a range, and the DI spread of 39.22 versus 5.20 shows sellers in near-total control.
Momentum is the complication. RSI on H1 reads 18.69, Stochastic sits at 7.56 against a signal of 5.46, and MACD is at -34.89 with a histogram of -8.92, still expanding lower. The H4 RSI at 15.05 and the D1 RSI at 25.20 confirm extreme oversold conditions across every timeframe. Bollinger Bands at $3,606.92 lower and $3,779.98 upper place price essentially on the lower band, while VWAP at $3,606.97 sits just above the close.
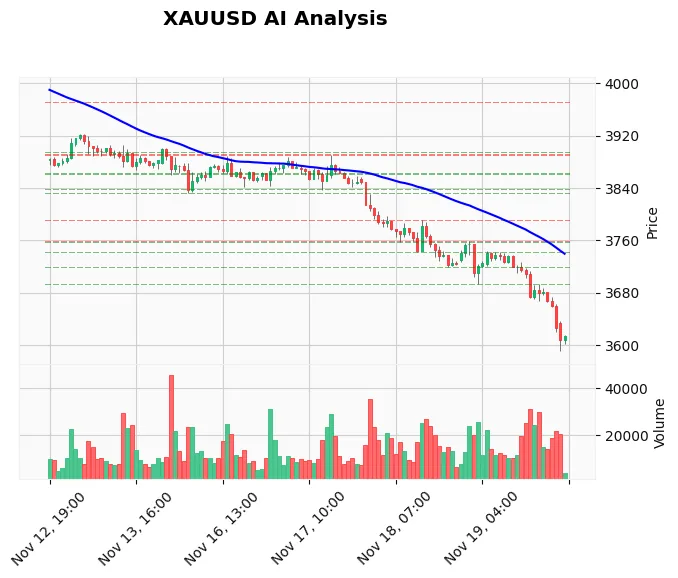
ATR at 24.01 gives a realistic daily range expectation of roughly $24 in either direction. The immediate downside reference is the session low at $3,585.68, which doubles as S1. A break there opens a measured move toward the $3,560-$3,570 zone derived from the ATR multiple. To the upside, the first meaningful resistance is $3,693.27, a level with four H1 touches that has flipped from support to resistance, followed by $3,719.72 with twelve touches and $3,742.80 with thirteen.
Fundamental Drivers
The dominant driver is Fed pricing. A 95% probability of a December quarter-point hike leaves little room for a dovish surprise, and every hawkish headline from Fed officials reinforces the dollar bid. Fed's Paulson declined to comment on December specifically but made clear that October's pause was never intended as a stopping point, which keeps the hike path intact.
Currency markets add a second layer. The PBOC is expected to set the USD/CNY reference rate near 6.6731, and a steady yuan against a strong dollar keeps Asian physical demand from providing its usual cushion. Geopolitical risk remains in the background, with markets awaiting Xi-Trump talks, but that has not been enough to slow the selloff. If you trade these headline-driven moves, our News Trading Bot is built to execute around high-impact releases without manual input.
Devil's Advocate
The bearish case is crowded. When RSI sits at 18.69 on H1, 15.05 on H4, and 25.20 on D1 simultaneously, the probability of a violent short-covering bounce rises with every candle. The structural void below price cuts both ways: with no support to lean on, a single large buyer can move the market quickly because there are no resting orders to absorb the flow.
The scenario that invalidates the bearish bias is a reclaim of $3,620.13, the prior day's low. A sustained H1 close above that level would suggest the breakdown was a liquidity grab rather than a trend continuation, and it would open a path back toward the $3,693.27 resistance. Until that happens, the trend remains lower, but traders should treat any long as a counter-trend scalp rather than a position trade.
Trading Strategy for This Session
The highest-probability setup is not a fresh short at market. Price is already extended, and entering here means chasing a move that has run more than 100 pips from the prior day's range with no structure behind the stop. The better approach is to wait for a pullback into the $3,660-$3,680 zone, where the EMA20 at $3,680.94 and the broken support cluster converge, and sell into that resistance with a stop above $3,693.27 and a target back at $3,585.68. That gives roughly 70 pips of risk against 80 pips of reward from a $3,665 entry, a shade under 1:1.2 — which is why the entry must be taken at the top of the zone, not the middle, to push the ratio toward 1:2.
Work the setup in three steps. First, mark $3,660 and $3,680 as the entry band and $3,693.27 as the invalidation line; do not place a limit order inside the band, wait for price to reach it and show a rejection wick on the H1. Second, size the position so that a 30-pip stop above $3,693.27 risks no more than 1% of equity. Third, take half the position off at $3,620.13 and trail the remainder toward $3,585.68, because the extreme RSI readings mean the final leg lower may stall before the target.
The mistake to avoid is shorting the first touch of $3,660 without confirmation. If the pullback is a genuine reversal rather than a retest, price will slice through the band and run for $3,693.27, and a stop placed just above the band gets taken out before the real move begins. The consequence is a full 1% loss on a trade that was never valid — and worse, it tempts the trader to re-enter at a worse price with a wider stop, doubling the damage. For traders who prefer to let the market come to them, our Price Action Pro EA is designed to identify exactly these broken-support-turned-resistance zones and execute the retest automatically. A secondary, lower-conviction idea is a counter-trend long from $3,585.68 with a tight stop below $3,575 and a target at $3,620.13, but this should be sized at half normal risk given the trend direction.
Risk Management
Position sizing matters more than usual in a market this extended. With ATR at 24.01, a stop of 15-20 pips is inside normal noise and will be taken out by a single wick. Use a minimum stop of 30 pips on any counter-trend trade and 25 pips on trend-continuation entries, which keeps risk-reward at 1:2 or better against the $3,585.68 target.
If the trade fails and price reclaims $3,620.13, exit without hesitation rather than averaging down. The bearish thesis is invalidated at that level, and holding a losing short into a potential short-covering rally is how accounts get damaged. Risk no more than 1% of equity on any single idea in this environment.
FAQ
What is the Gold price forecast for November 20 2026 Asia open?
The bias is bearish with a near-term target of $3,585.68, the session low and S1. A break below that level opens the $3,560-$3,570 zone. Resistance sits at $3,693.27, and a reclaim of $3,620.13 would neutralize the bearish setup.
Why is Gold falling to a 14-month low?
Markets price roughly a 95% chance of a December Fed hike, and the dollar is at a 19-month high. Higher rate expectations raise the opportunity cost of holding a non-yielding asset, and the technical breakdown below $3,700 accelerated the move.
Is Gold oversold enough to buy?
RSI at 18.69 on H1, 15.05 on H4, and 25.20 on D1 is extreme, but oversold is not a buy signal on its own. A counter-trend long from $3,585.68 is possible with a tight stop, but the trend remains lower and position size should be reduced.
What level would confirm a reversal?
A sustained H1 close above $3,620.13, the prior day's low, would be the first sign that sellers are losing control. Confirmation would require a push through $3,693.27, the nearest resistance with four H1 touches.
What is the next major support below $3,585?
There is no structural support in the sampled range below current price. The next reference is a measured move toward $3,560-$3,570 derived from the ATR multiple, which is why fresh shorts here carry poor risk-reward.
Conclusion
Gold enters the Asian session with momentum firmly to the downside and no structural floor beneath $3,585.68. The H1 EMA stack, ADX at 46, and the DI spread all point the same way, and the fundamental backdrop of hawkish Fed pricing and a 19-month dollar high reinforces the technical read. The one thing this market does not offer is a clean entry at current price.
Watch $3,585.68 as the level that decides whether the next leg lower begins, and $3,620.13 as the level that would signal the sellers have finally run out of conviction. Patience here is worth more than aggression. If you would rather have the setup monitored and executed without watching every candle, our automated Gold bot with 83% win rate applies the same structural logic across every session.
Trading Gold (XAU/USD) involves significant risk of loss. This content is for informational purposes only and does not constitute financial advice. Always conduct your own research and trade responsibly.