
Gold Price Forecast November 20 2026: $3,500 or $3,620 Next?
The Gold price today November 20 2026 Europe session sits at $3,568.30, and the market has just answered the first half of that question the hard way. XAU/USD printed a 14-month low at $3,541.03 overnight, then bounced $27 off the floor as the dollar eased into the London open.
That bounce is the whole story of this European session. Price is pinned between a broken $3,620 pivot above and the $3,514 shelf below, with the H1 EMA stack still stacked short and ADX at 59.32 confirming a violently established downtrend. The next $100 is a coin flip between a dead-cat squeeze and a fresh leg lower — and the levels tell you which side has the better odds.
Want to trade this Gold setup automatically while you read? Our AI Trading Bot runs 24/7 on XAU/USD and has already banked this week's short leg.
Gold Market Overview
Sentiment is about as one-sided as it gets. Gold has lost roughly 8% from the weekly open at $3,883.89 and is on course for its worst week since March, with the breakdown below $3,700 and then $3,600 both confirming a rate-driven selloff rather than a positioning flush.
The driver is the Fed. Hike bets have hardened all week, the dollar is strong across the board, and the headlines read like a roll call of capitulation: "XAU/USD in a freefall," "Gold hits 14-month low as strong dollar, rate bets weigh," "set for weekly drop amid Fed hike bets." Silver has been dragged to a fresh 14-month low near $41, which tells you this is a precious-metals repricing, not a gold-specific accident.
The one counterweight is geopolitical. Reports that the Trump administration is considering strikes on Iran are floating in the tape, and that is the kind of tail risk that can produce a violent safe-haven spike out of nowhere. It is not a trend driver yet — but it is the reason you do not chase shorts into a $3,541 low with a market this oversold.
There are no high-impact USD events on the calendar for the next two hours, so the European session should trade on flow and levels rather than data.
Technical Analysis
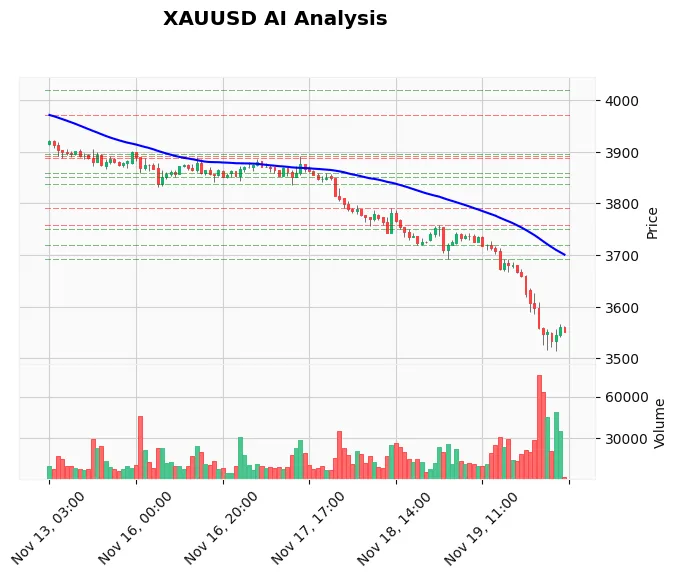
The H1 structure is a textbook downtrend: lower highs, lower lows, and price far below every moving average. EMA20 sits at $3,616.47, EMA50 at $3,688.94 and EMA200 at $3,843.08 — a fully bearish stack with price $48 below the nearest average. The H4 and D1 charts agree, with D1 EMA50 at $4,049.17 and D1 EMA200 at $4,217.45 far overhead.
Momentum is deeply oversold but not yet turning. RSI is 29.34 on H1, 18.50 on H4 and 24.28 on D1 — three timeframes in oversold territory at once. Stochastic reads 23.86/17.79 and MACD is -48.69 with the histogram still negative at -4.57. ADX at 59.32 with DI- at 32.45 against DI+ at 7.11 is the strongest trend reading on the board, and it argues that oversold can stay oversold.
Levels are clean. Support sits at $3,562.13 (VWAP, now acting as a pivot) and $3,514.36, with the H1 swing low at $3,514.26 just beneath. Resistance is $3,620.13 (prior day low, broken support), then $3,693.27 and $3,719.72 — both former supports now flipped to resistance. ATR is $28.82, so a normal session range is roughly $3,540 to $3,600.
Fundamental Drivers
Two forces matter today. First, the Fed: hike bets are the single dominant driver, and every strong-dollar headline reinforces the same trade. Until the rate narrative softens, rallies into resistance are selling opportunities, not trend changes. The mechanism is straightforward — higher expected policy rates lift real yields, and gold pays no coupon, so the opportunity cost of holding bullion rises with every hawkish repricing. That is why the selloff has been orderly and relentless rather than panicked: it is a valuation adjustment, and it does not stop on its own until the rate expectations stop climbing.
Second, geopolitics. The Iran strike consideration is a live tail risk that could flip sentiment in minutes. If you trade the news rather than the chart, an automated Gold news bot can execute the spike while you are still reading the headline. Note the asymmetry: a de-escalation headline removes the bid and lets the rate story resume, while an escalation headline can gap price straight through $3,620 without filling anyone's resting order. That is a reason to keep short exposure sized modestly, not a reason to flip long.
The next key event is any shift in Fed speak or a surprise in the dollar index — neither is scheduled in the immediate window, so watch the DXY tape for the real-time signal. A DXY stall at its own highs would be the first crack in the bear case, and it would show up in gold as a failed retest of $3,541 rather than a headline.
Devil's Advocate
The bear case has one obvious flaw: everyone already knows it. Price is $3,568 after a 14-month low, RSI is 29, and the nearest structural target below is $3,514 — only 54 points away. That is a poor reward for a fresh short, which is exactly why the desk is waiting rather than chasing.
If $3,620.13 reclaims and holds on an H1 close, the immediate downtrend is broken and a squeeze toward $3,693.27 becomes the base case. A headline on Iran would do it in one candle. The invalidation for the bearish bias is a sustained move back above $3,620, and the invalidation for any bullish scalp is a break of $3,514.
Trading Strategy for This Session
The higher-probability trade is a sell-the-rally, not a sell-the-low. The reload zone is $3,616 to $3,620, where the broken pivot and the H1 EMA20 converge. Enter short there with a stop at $3,645 (above the $3,630 Bollinger mid and the EMA20), targeting $3,562 first and $3,514 as the extended objective. That is roughly 1:2 risk-reward on the first target.
Work the numbers before you click. From a $3,618 entry, the stop at $3,645 risks $27, the first target at $3,562 pays $56, and the second at $3,514 pays $104 — so the trade only makes sense if you take the first target seriously and do not bail at breakeven on the first green candle. The $3,562.13 VWAP is the level that decides it: if price stalls there and prints a lower high, the second leg to $3,514 is live; if it slices through $3,562 with momentum, take the first target and stand down rather than hoping for the extension.
For the counter-trend scalp, a long only makes sense on a confirmed H1 close back above $3,575 with a stop under $3,541 and a target at $3,616. Size it at half normal — you are fighting ADX 59. The common mistake here is entering the long on the bounce off $3,541 without waiting for the $3,575 close; that entry sits inside the noise band, gets stopped by a single $28.82 ATR bar, and leaves you watching the move you called from the sidelines.
If you would rather let a system handle the execution, the Price Action Pro EA trades exactly this broken-support-flip structure on XAU/USD.
Risk Management
Risk no more than 1% of equity on any single entry, and cut that to 0.5% on the counter-trend long. With ATR at $28.82, a $30 stop is one normal bar of noise — do not place it tighter. The reward-to-risk on the reload short is 1:2 to the first target and 1:3.5 to the second, which is the minimum acceptable for a trend-continuation trade.
If the short is stopped at $3,645, do not re-enter immediately. Wait for a fresh lower high to form. If the long fails at $3,541, accept the loss and stand aside — the structural void below means the next support is far away.
FAQ
Is Gold going to $3,500 today?
A break of the $3,514.26 H1 swing low opens $3,500, and the weekly ascending triangle breakdown cited by analysts puts that level in focus. It is 54 points below the current price, so it is achievable within one ATR of range. The trigger is an H1 close below $3,514.
Why is Gold falling in the European session?
Hawkish Fed hike bets and a strong dollar are the dominant drivers, with gold at a 14-month low and silver at a 14-month low near $41. The move is a rate-driven repricing across precious metals, not a gold-specific event.
What is the key resistance for XAU/USD today?
$3,620.13 is the first level — the prior day low and broken support. Above that, $3,693.27 and $3,719.72 are the next flipped resistance zones. A sustained reclaim of $3,620 invalidates the immediate bearish bias.
Is Gold oversold enough to buy?
RSI is 29.34 on H1, 18.50 on H4 and 24.28 on D1, which is deeply oversold. But ADX at 59.32 with DI- at 32.45 says the trend is still strong, so oversold alone is not a buy signal. Wait for an H1 close above $3,575 before considering longs.
What is the Gold price forecast for the rest of the week?
The bias stays bearish while price holds below $3,620. The base case is a retest of $3,514 and then $3,500, with a squeeze toward $3,693 only if the $3,620 pivot is reclaimed. Watch the dollar index and any Iran headline for the wildcard.
Conclusion
Gold is oversold, but oversold is not the same as bottomed. The H1, H4 and D1 trends all point down, ADX confirms the trend is strong, and the fundamental driver — Fed hike bets and a strong dollar — has not changed. The $3,541 low is the line in the sand; $3,620 is the line that would flip the bias.
Between those two levels, patience pays better than aggression. Sell the rally into $3,616-$3,620, keep stops above $3,645, and let the market prove the next leg rather than guessing it.
If you want the levels traded for you while you manage the bigger picture, the best-selling Gold trading bot is built for exactly this kind of high-conviction trend session.
Trading Gold (XAU/USD) involves significant risk of loss. This content is for informational purposes only and does not constitute financial advice. Always conduct your own research and trade responsibly.