Gold Price Forecast April 22 2026 Asia Open: Bears Control $4,740
The Gold price forecast April 22 2026 Asia open points to a market under bearish pressure, with XAUUSD trading precariously near the $4,740 level. As the Asian session commences, the metal is consolidating just above critical support at $4,737.07, following a sharp rejection from the $4,748.15 20-day EMA. This positioning, combined with hawkish Fed speculation and easing Middle East tensions, suggests the path of least resistance is lower for now. Traders should prepare for a test of the immediate floor. For those looking to automate such bearish setups, our AI Trading Bot is designed to execute 24/7 with precise entry and risk management.
Gold Market Overview
The overnight session saw Gold relinquish its grip on the $4,750 level, closing the New York session at $4,739.68. Market sentiment remains decidedly risk-off for the precious metal, as a confluence of factors strengthens the US Dollar. The primary narrative centers on Federal Reserve policy expectations, with the confirmation hearings for nominee Kevin Warsh introducing a potential hawkish shift. Concurrently, hopes for de-escalation in Iran have temporarily sapped safe-haven demand, redirecting capital toward equities. The robust US Retail Sales data further cements the view of a resilient US economy, allowing the Fed to maintain a restrictive stance for longer. This macro cocktail leaves Gold vulnerable, with the Asian session likely to see subdued, range-bound action as traders await fresh catalysts from Europe and the US.
Technical Analysis
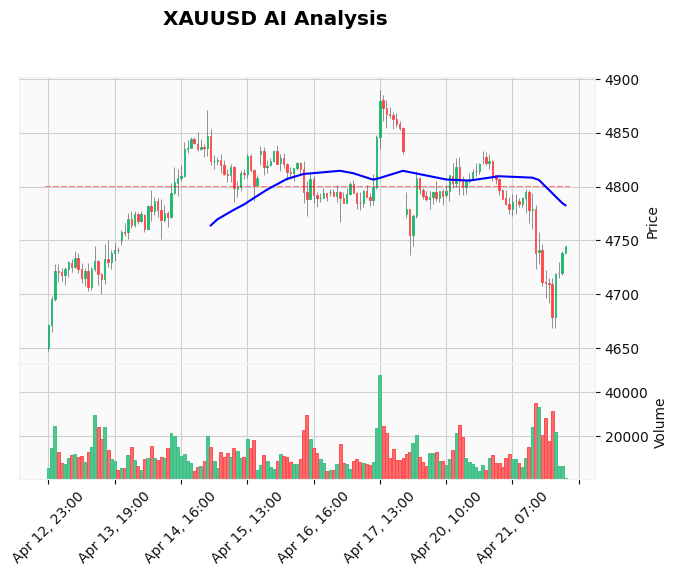
The technical structure for XAUUSD is bearish across multiple timeframes. On the daily chart, price is trading below all key Exponential Moving Averages: the 20-day EMA at $4,748.15, the 50-day at $4,774.49, and the 200-day at $4,772.14. This EMA stack presents a formidable wall of resistance overhead. The immediate battleground is the $4,737.07 support (S1). A confirmed daily close below this level would open the door for a deeper decline toward the secondary support zone around $4,644.34 (S2).
The RSI reading of 44.16 sits in bearish territory but is not yet oversold, indicating there is room for further downside momentum. The MACD histogram remains negative at -20.96, residing below its signal line, reinforcing the bearish bias. The Average True Range (ATR) of 24.24 points suggests today's potential trading range could be approximately $25, highlighting where strategic stop losses should be placed. The nearest resistance is far above at $4,838.31 (R2), followed by $4,889.44 (R1), making any bullish reversal a significant uphill battle. Tools like our Gold technical analysis tools can help traders monitor these key levels in real-time.
Fundamental Drivers
Three core fundamental themes are dictating Gold's weakness at this Asia open. First, the Federal Reserve's policy path is the dominant force. The Senate hearings for Fed nominee Kevin Warsh are being closely watched, with markets interpreting his stance as potentially more hawkish than the current board. This is keeping US Treasury yields elevated and supporting the Dollar, a direct headwind for non-yielding Gold.
Second, geopolitical risk premiums are deflating. News flow suggesting potential progress in US-Iran negotiations has reduced immediate safe-haven bids. While the situation remains fluid, the absence of fresh escalation allows traders to focus on macro fundamentals. Third, strong US economic data, particularly the recent Retail Sales figures, undermines arguments for imminent Fed rate cuts. This data-dependent, "higher-for-longer" rate environment is inherently challenging for Gold bulls. For traders who want to react instantly to such news-driven moves, an automated Gold news bot can capture volatility that manual trading often misses.
Devil's Advocate
While the evidence leans bearish, a sudden shift is possible. The primary risk to the downside view is a technical failure at the $4,737 support. If Asian or early European buyers aggressively defend this level and push price back above the 20-day EMA at $4,748, it could trigger a short-covering rally toward $4,770-$4,775. Fundamentally, any headline indicating a collapse in Iran talks or a surprisingly dovish twist in Warsh's testimony could instantly reverse sentiment. Furthermore, if upcoming US data (like jobless claims or PMIs) disappoints, it could revive bets on 2026 rate cuts, weakening the Dollar and providing Gold with unexpected lift. The key invalidation level for bears is a sustained break above $4,775.
Trading Strategy for This Session
Given the bearish technical alignment and fundamental backdrop, the strategic bias for the Asia session is to look for selling opportunities on minor rallies. The ideal sell zone resides between $4,745 and $4,750, where price meets the confluence of the 20-day EMA and recent breakdown resistance. A sell entry in this zone, with a stop loss placed safely above $4,775, offers a favorable risk-reward profile. The primary take-profit target is the $4,700 psychological level, with secondary targets at $4,670 and the major $4,644 support. This precision-focused approach is what our Price Action Pro EA executes systematically, identifying and trading such SMC-based retests.
Risk Management
In a bearish environment, strict risk management is paramount. Position size should be calculated so that a loss from $4,750 to $4,775 does not exceed 1-2% of your trading capital. The recommended risk-reward ratio for the described setup is a minimum of 1:2. If price breaks above $4,775, the bearish thesis is compromised, and the trade should be abandoned—do not move the stop loss. Conversely, if the trade moves in your favor, consider moving your stop loss to breakeven once price reaches the first target ($4,700) to eliminate risk. Discipline in adhering to these rules separates successful traders from the rest.
Frequently Asked Questions (FAQ)
Q: Why is Gold going down today?
A: Gold is facing pressure from three main factors: 1) Hawkish expectations surrounding Fed nominee Kevin Warsh, 2) Reduced safe-haven demand due to hopes for Iran peace talks, and 3) Strong US Retail Sales data that supports a "higher-for-longer" interest rate environment, boosting the US Dollar.
Q: What is the key support level for XAUUSD right now?
A: The most immediate and critical support level is $4,737.07. A sustained break and daily close below this level could trigger further selling toward the next major support around $4,644.34.
Q: Should I buy Gold at this dip?
A> Buying the dip is a high-risk strategy in the current context. The technical structure is bearish, and fundamentals are not supportive. It would be safer to wait for a clear bullish reversal signal, such as a strong rebound from $4,737 support and a break above the $4,775 resistance, before considering long positions.
Q: How does Fed policy affect Gold price?
A> The Federal Reserve's interest rate decisions directly influence the US Dollar and Treasury yields. Higher interest rates (or expectations of them) make the USD more attractive and increase the opportunity cost of holding non-yielding Gold, typically pushing its price down. This relationship is a core component of professional trading education.
Conclusion
The Asia open finds Gold in a defensive posture, tethered to the $4,740 level with bearish forces mounting. The alignment of technical resistance from the EMA cluster and fundamental headwinds from Fed policy creates a challenging environment for bulls. The $4,737 support is the line in the sand; a breach here could accelerate the decline. Traders should maintain a patient, reactive stance—capitalizing on retests into resistance while remaining alert to any fundamental shift that could alter the momentum. To navigate these complex conditions with consistency, many traders rely on automated systems. Our best-selling Gold trading bot applies this precise, data-driven analysis continuously, removing emotion and executing high-probability setups 24 hours a day.
Risk Disclaimer: Trading Gold (XAU/USD) involves significant risk of loss. This content is for informational purposes only and does not constitute financial advice. The market analysis, prices, and trade ideas are illustrative. Always conduct your own research, consider your financial situation, and trade responsibly. Past performance is not indicative of future results.