Gold Price Forecast Week June 06 2026: $4,100 in Sight?
Gold just suffered one of its worst weekly drubbings in recent memory. A staggering $212 selloff—over 4.6%—was triggered by a far stronger than expected U.S. jobs report, turning the shiny metal’s technical picture decisively bearish. As we step into a light data week, XAU/USD clings near $4,325 after a violent breakdown through the 200‑day moving average. With no high‑impact US events on the calendar, the path of least resistance points lower, and the key question is whether the $4,100 support zone will be tested before any meaningful bounce. For traders looking to stay on the right side of this momentum, our AI Trading Bot has already been executing precision shorts in this environment with an 83%+ win rate.
Last Week in Review
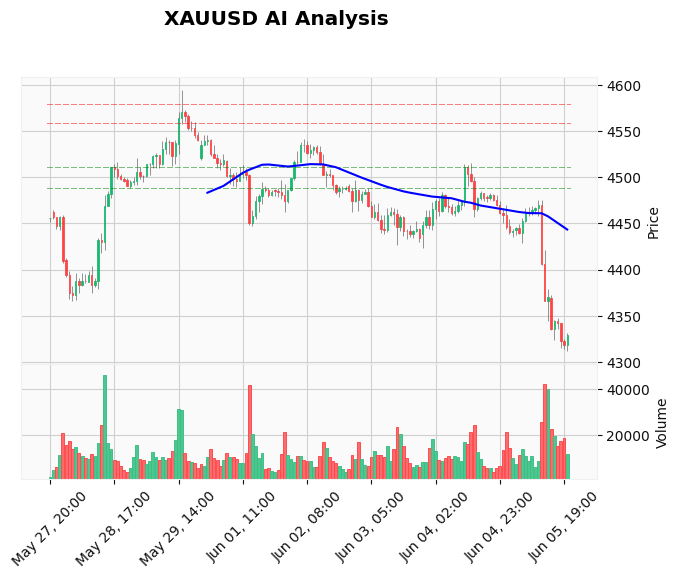
Gold opened the week at $4,540.23 and showed initial stability until Friday’s U.S. Non‑Farm Payrolls release smashed forecasts. The Bureau of Labor Statistics reported job gains well above consensus, sending the US Dollar Index (DXY) surging above 100 and 10‑year Treasury yields to fresh highs. In a matter of hours, XAUUSD collapsed from above $4,400 to an intra‑week low of $4,311.65 before closing at $4,327.73.
The weekly range—$234.33—was more than double the average, underscoring the violent liquidation. Notably, gold sliced through the 200‑day EMA ($4,380) and the psychological $4,400 handle without hesitation, confirming that institutional sellers were in control. The damage was broad‑based; even silver (XAG/USD) crashed toward its 200‑day SMA, reinforcing the bearish macro signal. Post‑NFP, Fed official Hammack quickly poured cold water on any near‑term rate‑cut hopes, extinguishing the last hopes of a dovish pivot.
The weekly close below the 200‑day EMA for the first time since early 2025 turns that former dynamic support into formidable resistance. Traders should note the closing price also settled below the 50‑week EMA, adding to the medium‑term bearish structure.
Weekly Technical Outlook
The daily and weekly charts paint a picture of overwhelming bearish momentum. Price sits beneath all three key exponential moving averages: the 20‑day EMA at $4,518.86, the 50‑day at $4,612.28, and the 200‑day at $4,380.07. The death cross—where the 50 EMA crosses below the 200 EMA—remains firmly in play, a classic signal of a prolonged downtrend. Moreover, the 20 EMA is sharply declining, acting as a dynamic resistance ceiling for any intra‑week bounces.
The Weekly RSI (14) has plunged to 34.27, teetering on the edge of oversold territory but still leaving room for further downside. Historically, gold does not bottom until RSI dips below 30, so the current reading suggests the selling pressure may persist for another 1‑2 weeks. The MACD histogram deepens into negative territory at ‑64.15 with the signal line at ‑53.41, and no bullish divergence is forming—momentum is cleanly aligned with the trend.
Volatility exploded, with Average True Range (ATR) now at $106.42, meaning daily swings of $100+ are the new normal. This elevated ATR both increases risk and offers wider profit targets for swing traders.
Three Scenarios for the Week Ahead
Scenario 1 – Bearish (Base Case)
The most likely path. Gold continues to grind lower, breaching the minor $4,300 handle and retesting the post‑NFP low near $4,311. A break below that low opens the door to the next major support at $4,099.02 (S1). Given the lack of high‑impact data, the move may be driven by momentum traders and continued USD strength. In this scenario, any rallies towards $4,360–$4,402 will be sold aggressively, with the 200‑day EMA acting as a ceiling. Target: $4,100–$4,050.
Scenario 2 – Bullish (Low Probability)
For bulls to regain any control, gold must reclaim and hold above the $4,402.72 level (the broken support‑turned‑resistance) and preferably the 200‑day EMA. A close above $4,410 would trigger a short‑squeeze towards the $4,500 zone, but this would require a catalyst—such as an unexpected geopolitical shock or a sudden dovish Fed repricing—neither of which appears imminent. Without that, any bounce is likely to fail.
Scenario 3 – Neutral / Consolidation
With no US top‑tier data, gold could enter a range‑bound phase between $4,300 and $4,400 as bears take profit and bulls try to establish a bottom. The wide ATR may shrink, and the market could whip back‑and‑forth within this band, testing both boundaries multiple times. A weekly doji would signal indecision but would not alter the prevailing bearish bias unless accompanied by a close above $4,402.
Fundamental Outlook
The fundamental backdrop remains toxically bearish for gold. The June NFP report wasn’t just good—it was blockbuster, adding to the string of resilient US economic data. This reinforces the Federal Reserve’s hawkish stance and makes rate cuts a distant prospect. With DXY firmly above 100 and real yields climbing, non‑yielding gold loses its appeal.
Adding to the pressure, risk appetite across global markets has been robust, drawing capital away from safe havens. The Philippine peso’s hawkish central bank path, the South Korean won’s semiconductor headwinds, and the Kiwi’s plunge all highlight a strong‑USD environment that hurts commodities. Even silver crashed toward its 200‑day SMA, confirming that the precious metals complex is in a broad selloff.
Fed rhetoric continues to tilt hawkish. After NFP, Hammack’s comments closed the door on near‑term easing, and market pricing for a July rate cut has evaporated. Next week’s empty economic calendar means this narrative will likely persist without interruption. However, traders should be mindful that in extremely oversold conditions, gold can stage sharp positioning‑driven snapbacks, especially ahead of the weekend. But with no hawkish‑dove surprises on the radar, those rips are selling opportunities.
Economic Calendar: Week of June 06‑12, 2026
The week ahead is devoid of high‑impact US economic releases, a rarity that shifts the focus squarely to technicals and risk sentiment. Below is the scheduled data (or lack thereof).
| Date | Time (UTC) | Event | Impact |
|---|---|---|---|
| Jun 06 – Jun 12 | — | No high‑impact USD events scheduled | — |
Quiet weeks like this often see trend continuation, as there are no new catalysts to reverse the momentum. Intra‑day price action will be driven by technical flows, equity market mood, and any geopolitical headlines. Traders should guard against complacency—low volatility days can produce sudden spikes when liquidity is thin.
Gold Trading Strategy This Week
The trading bias is sell on rallies. With the dominant trend down and no immediate fundamental threat to USD strength, short positions carry a higher probability of success.
Swing Trade Setup:
Enter a short position on a retest of the $4,360–$4,402 resistance zone, which aligns with the recent breakdown level and the 200‑day EMA. Place your stop loss above $4,410, granting a buffer above the weekly pivot high. First profit target is $4,300 (psychological level), with a second target at $4,100. This offers a risk‑reward ratio of approximately 1:3 when using a 40‑point stop. Manage the trade actively; trail the stop once the price breaks $4,300 to lock in gains.
Day Trading Tactic:
Aggressive traders can look for intra‑day break‑down entries below $4,320 after a failed bounce. Keep stops tight at $4,345 and aim for a quick move to $4,280‑$4,270. Given the elevated ATR, use reduced position sizes to accommodate wider stops.
For those who prefer automated execution, our Price Action Pro EA thrives in trending markets like this, identifying high‑probability short entries based on smart money concepts and order blocks—essential when price is moving at lightning speed.
Risks to Watch
The main risk to the bearish thesis is a swift reclaim of the $4,402 level and a daily close above the 200‑day EMA. That would indicate a failed breakdown and could trigger a violent short‑squeeze, pushing gold back toward $4,600. A black‑swan geopolitical event—such as an escalating conflict or a sudden central bank intervention—could also reverse the USD rally and ignite safe‑haven demand for gold.
Additionally, because the RSI is approaching oversold, the risk of a corrective bounce increases with each passing day. Such a bounce should be viewed as an opportunity to add to shorts at better prices, not as a trend reversal. Position sizing and discipline remain paramount; a single mis‑timed entry in a volatile market can lead to steep losses.
Frequently Asked Questions
Why did gold drop so sharply last week?
The June Non‑Farm Payrolls report significantly beat expectations, boosting the US Dollar and Treasury yields. This convinced the market that the Federal Reserve will keep rates higher for longer, stripping gold of its opportunity‑cost advantage and triggering a massive sell‑off. The move was amplified by technical stops below key moving averages.
What is the next major support level for XAUUSD?
After the immediate $4,300 psychological handle, the next significant support sits at $4,099.02, identified as the primary technical support from our webhook data. If that level breaks, the door opens to the $4,000 round number and even the $3,900 region.
Is it safe to buy gold now?
At this moment, buying gold is counter‑trend and risky. The RSI is still above oversold, and the macro‑fundamentals are overwhelmingly bearish. Any long entry should wait for a clear reversal signal, such as a daily close back above the 200‑day EMA, or at least a bullish divergence on the RSI. Until then, the trend is your friend—and it points down.
How does the strong US dollar affect gold prices?
Gold is priced in US dollars, so a stronger dollar makes gold more expensive for foreign buyers, dampening demand. Furthermore, a rising dollar usually reflects higher US interest rates, which increase the opportunity cost of holding non‑yielding gold. The inverse correlation between DXY and XAUUSD has been almost perfect this year, and with DXY above 100, it’s a major headwind for gold.
What is the ATR and why is it important this week?
The Average True Range (ATR) measures market volatility. Currently at $106.42, it signals that gold may move more than $100 in a single day. This is crucial for position sizing: traders should widen stops and reduce lot sizes to avoid being prematurely stopped out in a choppy environment. It also means profit targets can be set further away, improving risk‑reward ratios.
Will there be any events next week that could move gold?
There are no high‑impact US economic events scheduled for the week of June 06–12. This leaves technical analysis and general risk sentiment as the main drivers. Traders should still monitor any unscheduled Fed speeches or geopolitical developments that could inject volatility.
Conclusion
Gold enters the new week nursing a deep wound after its worst performance in months. The technical picture is overwhelmingly bearish, with price below all major moving averages, momentum firmly negative, and RSI still pointing lower. Fundamentally, a strong US dollar and hawkish Fed are heavy anchors. With no data to challenge this narrative, the bias remains to the downside, targeting $4,100 initially.
The key tactical rule this week: sell rallies, don’t chase breakdowns. Wait for price to retest resistance near $4,360–$4,402 before committing capital, and keep stops generous in this high‑ATR environment. Whether you’re a day trader or a swing trader, discipline in risk management will separate the profitable from the wiped‑out.
In markets like this, having an automated edge can be a game‑changer. Our range of Expert Advisors for XAUUSD can help you execute these setups without emotion, around the clock. Stay patient, stay protected, and let the trend do the work.
Trading Gold (XAU/USD) involves significant risk of loss. This content is for informational purposes only and does not constitute financial advice. Always conduct your own research and trade responsibly.