How to Use DXY and Gold Correlation When Trading XAUUSD
Every week I see traders buy Gold at a clear support level only to watch price tumble 50 dollars in minutes. They check their charts, mess with their indicators, but miss the one variable that explains the whole move: the US Dollar. Gold and the Dollar have one of the most reliable, high-probability relationships in the market, yet most retail traders ignore it completely. Once you understand how to read the US Dollar Index (DXY) alongside XAUUSD, your entries become sharper, your exits more precise, and your confidence jumps dramatically.
This guide will teach you exactly what that correlation looks like, when it breaks, and how to build a trading plan that uses DXY as your edge. If you want to automate this analysis, our AI Trading Bot monitors DXY and Gold simultaneously on a 24/7 basis, taking setups you might miss at 3 a.m.
What Is DXY and Gold Correlation?
The US Dollar Index (DXY) measures the value of the Dollar against a basket of six major currencies. Because Gold is priced in US Dollars worldwide, anything that pushes the Dollar higher makes Gold more expensive for foreign buyers, reducing demand and typically pushing Gold lower. The inverse is also true: a weak Dollar makes Gold cheaper and demand rises.
This negative correlation means that a strong DXY rally often sends XAUUSD down, and a DXY sell-off lifts Gold. The relationship isn’t perfect—you’ll see occasional days where both move in the same direction—but over a large sample of trades, the expected direction is firmly negative. On a daily timeframe, the correlation coefficient sits around -0.7 to -0.9, which is extremely high for two unrelated assets.
Think of DXY as the engine behind Gold’s macro trend. When you check DXY before taking a trade, you immediately know whether the underlying current supports or fights your bias. Many traders who lose on XAUUSD re-entered the market with the wrong DXY context without realizing it.
Why It Matters for Gold Traders
Adding DXY to your pre-trade checklist changes everything. A buy signal on Gold that aligns with a falling Dollar has a much higher probability than the same signal while DXY is ripping higher. You’ll start filtering out false breakouts, recognizing when a pullback is actually a continuation, and you’ll stop getting chopped out of good trades.
For example, earlier this year I watched a perfect double-bottom form on XAUUSD at 4300, with RSI divergence and a bullish MACD cross. Without DXY, it looked like a strong buy. However, DXY was simultaneously breaking above a 4-month resistance level. The setup failed spectacularly. Traders who only look at Gold missed the warning.
Understanding this correlation also lets you spot decoupling events—periods where both assets rise or fall together—which often signal major geopolitical fear or extreme liquidity events. If you’re new to the concept, our Gold trading courses build this skill from the ground up so you don’t have to learn the hard way.
How to Use It Step by Step
Step 1: Identify DXY key levels. Just like you map support and resistance on Gold, do the same on the DXY daily chart. Mark recent highs, lows, and round numbers (100, 104, 106). When DXY approaches a major level, expect a reaction. If DXY is testing a resistance level, Gold is likely testing a support area—and vice versa.
Step 2: Wait for DXY confirmation before entering Gold. Never assume what DXY will do. If you’re bearish on Gold, wait for DXY to actually break higher or hold above a key level. If DXY is stuck in a tight range, Gold will chop too. Only enter when the Dollar gives you a clear directional cue.
Step 3: Use DXY divergence as an early warning. When XAUUSD makes a lower low while DXY fails to make a higher high, that’s a powerful reversal signal. The divergence shows that sellers are losing steam in Gold even though the Dollar isn’t strengthening further. This is one of my favorite swing trade entries.
Step 4: Combine with basic technicals. Overlay RSI and the 20 EMA on both charts. If Gold touches support while the 20 EMA on DXY curls down from resistance, the bullish confluence is exceptional. Never trade correlation in isolation—always wait for multiple factors to align.
Step 5: Size correctly and manage risk. Even the cleanest correlation setups fail when major news hits. Never risk more than 1-2% of your account on any single trade. Many professional traders run this type of correlation-based analysis on a Windows VPS for Gold trading to ensure constant monitoring without interruptions.
Common Mistakes Gold Traders Make
1. Assuming the correlation is 100%. The biggest error is treating DXY as a perfect mirror of Gold. Correlation weakens during extreme risk events when both become safe havens. Always confirm with other evidence.
2. Ignoring DXY timeframes. A 5-minute DXY rally might not matter if the daily trend is bearish. Match the timeframe of your Gold trade with the same DXY timeframe to avoid noise.
3. Entering too early expecting the correlation to kick in. Waiting for DXY confirmation keeps you out of traps. Patience here is more profitable than being first.
4. Neglecting correlation decoupling. When both assets start moving together unexpectedly, it’s often a signal to step aside. Don’t force a trade simply because the normal relationship should resume.
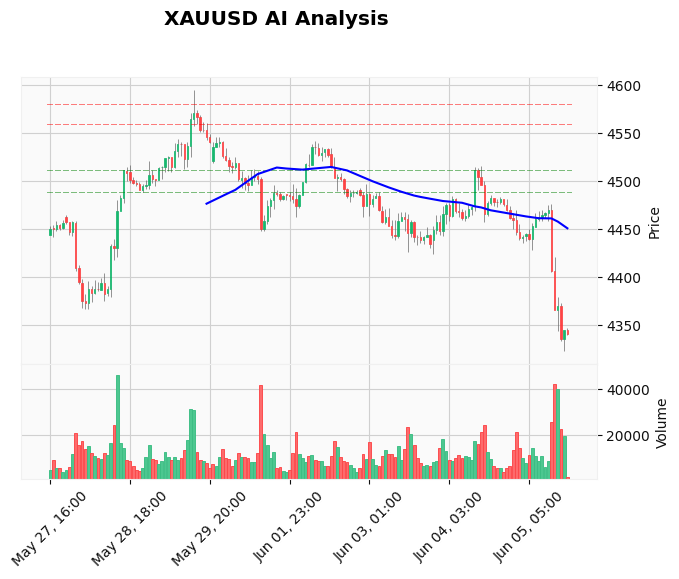
Real Example on XAUUSD Chart
On June 4 this year, DXY surged above 104.50 after a much stronger-than-expected ISM Services PMI report. Gold, which had been consolidating near 4360, collapsed within an hour to 4345. A trader watching DXY would have seen the breakout early and looked for short entries. In that scenario, a short at 4345 with a stop loss above 4365 and a first target at 4320 provided a clean 2:1 reward-to-risk setup. The correlation worked beautifully, rewarding those who paid attention to the Dollar.
For traders who want to capitalize on these news-driven DXY moves without sitting glued to the screen, our News Trading Bot automatically places XAUUSD trades the moment high-impact USD data drops. It eliminates emotional second-guessing and keeps you aligned with the correlation.
Frequently Asked Questions
What is the correlation between DXY and Gold?
DXY and Gold share a strong inverse relationship. When the US Dollar strengthens against major currencies, Gold priced in Dollars becomes more expensive for international buyers, lowering demand and pushing price down. The correlation coefficient regularly sits between -0.7 and -0.9, but it isn’t absolute. During risk-off crises, both can rally together as safe havens, so context matters.
Does the DXY–Gold correlation always hold?
No. While the negative correlation is reliable in normal market conditions, it breaks during extreme geopolitical events, major central bank interventions, or sudden liquidity crunches. For instance, in 2020 both Gold and the Dollar rose in March’s panic selloff. That’s why using DXY as a confirmation tool—not a standalone signal—is the smarter approach.
How can I trade Gold using DXY signals?
Start by identifying key support and resistance levels on DXY. Wait for a clear break or bounce from those levels, then look for a corresponding trade on XAUUSD in the opposite direction. Combine with trend analysis, RSI divergence, or moving averages to filter out false moves. Always set a stop loss and never assume the correlation will hold through news.
What are the best indicators to combine with DXY correlation?
RSI divergences, 20 and 50-period EMAs, and MACD crossovers work well alongside the DXY relationship. Watching both charts with identical indicators helps spot hidden strength or weakness that a single chart might miss. Many traders also overlay volume profiles to confirm breakouts.
Can automated bots use DXY data for Gold trading?
Yes. Advanced trading bots can track DXY movements in real time and open XAUUSD positions based on correlation rules. For traders who want a hands-free approach, platforms like our AI Trading Bot integrate multiple currency cues, including DXY, to make decisions 24/7.
Conclusion
Watching Gold without DXY is like driving with one eye closed—you’ll miss half the information that matters. The negative correlation isn’t a secret, but the edge comes from knowing when to trust it, when to question it, and how to build it into your daily routine. Next time you prep a trade, pull up the DXY daily chart first, mark the levels, and let it guide your bias. The improvement in your win rate will be impossible to ignore.
If you’d rather skip the manual screen time, our AI Trading Bot handles the correlation analysis for you around the clock, opening high-probability XAUUSD setups automatically. Try it and see how much easier trading becomes when you don’t have to watch two screens at once.
Risk Disclaimer
Trading Gold (XAU/USD) involves significant risk of loss. This content is for informational purposes only and does not constitute financial advice. Always conduct your own research and trade responsibly.