XAUUSD US Session Forecast April 20: Key US Data to Decide Gold's Next Move
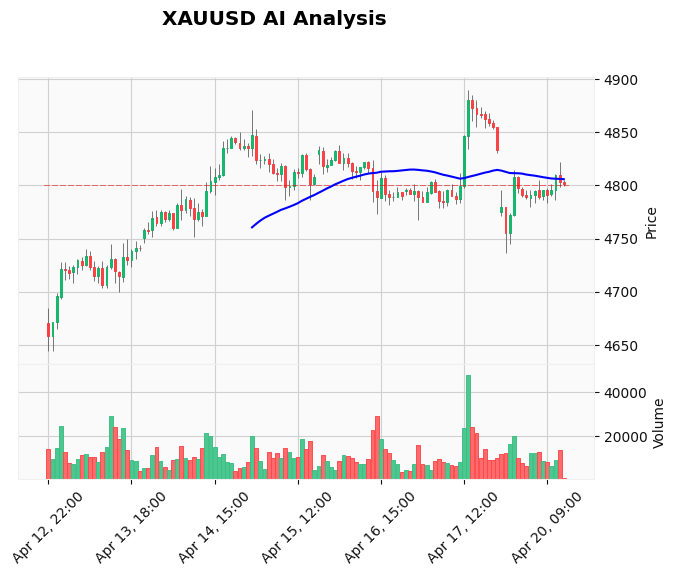
The XAUUSD US session forecast April 20 hinges on a critical technical pivot at $4,800 as gold traders brace for tomorrow's high-impact US economic data. Currently trading at $4,818, XAUUSD shows neutral momentum with immediate resistance at $4,838 and key support at $4,775. With Retail Sales and Core Retail Sales data due in approximately 22 hours, the American session sets the stage for pre-data positioning that could define the week's direction. The market is trapped in a tight $4,780-$4,825 range, awaiting a catalyst to break free. Want to navigate these data-driven moves automatically? Our AI Trading Bot analyzes real-time fundamentals and executes trades 24/7 on XAUUSD with precision.
Gold Market Overview
The US session opens with Gold (XAUUSD) displaying textbook indecision at $4,818, essentially unchanged from the European close. This lack of momentum reflects the market's anticipation of tomorrow's dual USD catalysts: Retail Sales and Core Retail Sales, both forecast significantly higher than previous readings at 1.4% and 1.3% respectively. The US Dollar Index (DXY) has held steady through the European morning, applying subtle but consistent pressure on dollar-denominated gold. Geopolitical tensions between the US and Iran continue to provide a fragile safety bid, but recent price action shows this support is sporadic rather than sustained. The dominant macro theme remains the Federal Reserve's policy path, with tomorrow's data potentially strengthening the case for a more hawkish stance if forecasts materialize. Market sentiment is cautious, with traders reluctant to establish large directional positions ahead of the high-impact releases.
Technical Analysis
The technical picture for XAUUSD shows a market caught between conflicting timeframes. On the daily chart, the bullish structure remains intact with price holding above the key EMA 200 at $4,772. However, the hourly chart reveals a frustrating consolidation range between $4,780 and $4,825. The EMA structure provides minimal guidance: the 20-period EMA at $4,804 sits virtually atop the 50-period EMA at $4,806, creating a flatlined ribbon that confirms the short-term trend is neutral. RSI at 54.44 reflects balanced momentum, neither overbought nor oversold. The MACD histogram shows slight bearish divergence with a reading of -2.57, but it's above its signal line, suggesting the momentum drop may be slowing.
Key levels from our TradingView analysis are clear: Resistance at $4,838.31 (R1) represents the immediate ceiling, followed by a more significant barrier at $4,871.31 (R2). On the downside, initial support clusters around $4,775-$4,780—a zone combining the previous swing low and institutional buy-side liquidity. A break below $4,775 would challenge the next major support at $4,698.47 (S2) and threaten the daily bullish structure. The Average True Range (ATR) of 20.82 indicates we can expect approximately a $21 move once volatility expands from its current compressed state.
Fundamental Drivers
All eyes are on the impending US economic data scheduled for Tuesday. The Retail Sales and Core Retail Sales releases represent the most significant fundamental catalyst for gold in the next 24 hours. Forecasts calling for substantial increases (1.4% vs. 0.6% previous for headline, 1.3% vs. 0.5% for core) suggest strong consumer spending, which typically boosts the USD and pressures gold. The market is pricing in the probability that strong data could reinforce the Fed's hawkish inclination, particularly with Fed nominee Warsh's testimony also on the calendar. The political pressure on the Federal Reserve, highlighted by recent headlines, adds another layer of uncertainty to the interest rate outlook.
Geopolitical risk from US-Iran tensions continues to simmer but has failed to generate sustained safe-haven flows into gold. This suggests the market views these tensions as contained rather than escalating toward immediate conflict. For gold traders, the fundamental setup over the next 24 hours is clearly USD-positive and gold-negative—unless the data significantly underperforms forecasts. Automated news trading requires split-second execution. Our News Trading Bot scans headlines and economic calendars to capitalize on exactly these types of high-impact events.
Devil's Advocate
While the fundamental setup appears bearish for gold, several scenarios could spark an unexpected rally. First, if the Retail Sales data significantly misses forecasts (a possibility given recent consumer sentiment indicators), the USD could weaken dramatically, sending gold back toward the $4,870 resistance. Second, geopolitical tensions could escalate unexpectedly during the US session, triggering a flight to safety that overrides economic data concerns. Third, technical buyers may defend the $4,775-$4,780 support zone aggressively, creating a bounce that catches bears off guard. The daily chart remains bullish overall, so any breakdown below $4,775 needs to be confirmed with follow-through selling. Without that confirmation, this could simply be a pre-data shakeout before another leg higher.
Trading Strategy for This Session
Given the pre-data uncertainty and compressed volatility, the most prudent approach for the US session is to trade the range with tight risk parameters or wait for clearer signals. For range traders: Consider selling near $4,830-$4,838 resistance with a stop above $4,845 and targeting $4,795-$4,800. Conversely, buying near $4,780-$4,785 support with a stop below $4,775 and targeting $4,815-$4,820 offers a balanced risk-reward profile. Position sizes should be reduced by 30-40% given the impending data risk.
For breakout traders: Prepare for a decisive move. A confirmed break above $4,838 (closing above on H1) targets $4,871 and potentially higher. A confirmed break below $4,775 (closing below on H1) targets $4,745 initially, then $4,698. Wait for the break and retest before entering, rather than anticipating the move. This precise strategy of trading range breaks is exactly what our Price Action Pro EA executes automatically, identifying institutional order flow at key levels.
Risk Management
Today's session demands exceptional discipline. Given the compressed ATR and impending data, position sizing is crucial: risk no more than 0.5-0.75% of capital per trade rather than the typical 1%. The most dangerous scenario is getting caught in a false breakout before the actual data release. If you enter a trade and price immediately reverses against you without reaching your target, consider exiting at breakeven rather than holding through the data. The 1:2 risk-reward ratio remains the minimum standard, but achieving this may require wider stops than usual due to the expected post-data volatility. Always know your exact exit points before entering, and never move your stop loss further away once the trade is live. For traders who struggle with discipline, consider Cloud Copy Trading to automatically mirror proven strategies without emotional interference.
Frequently Asked Questions
Q: What time is US Retail Sales data released, and how does it affect gold?
A: The US Retail Sales and Core Retail Sales data is scheduled for release on Tuesday at 12:30 UTC (approximately 22 hours from the time of this analysis). Strong data typically strengthens the US Dollar as it suggests a robust economy and potential for higher interest rates, which puts downward pressure on gold prices. Weak data has the opposite effect, weakening the dollar and supporting gold.
Q: What is the most important support level for XAUUSD right now?
A: The most critical support zone is $4,775-$4,780. This area represents a confluence of technical factors including the previous swing low and institutional buying interest. A daily close below $4,775 would signal a potential trend change and open the path toward $4,698 support.
Q: Should I trade gold ahead of the US data, or wait?
A> For most retail traders, waiting for the market's reaction to the data is the safer approach. The pre-data environment often features low liquidity and false moves. Professional traders might take small positions at key technical levels, but with strictly managed risk. Automated systems can handle this volatility better than manual traders.
Q: What happens if gold breaks above $4,838 resistance?
A: A confirmed break above $4,838 resistance would invalidate the current bearish setup and target the next resistance at $4,871. Such a move would require either weak USD data, escalating geopolitical tensions, or a technical squeeze of short positions. The daily trend would resume its bullish course toward the $4,900 area.
Conclusion
The XAUUSD US session presents a classic pre-data consolidation with price compressed between $4,780 and $4,825. While the technical picture shows neutrality, the fundamental setup leans bearish given the forecast for strong US Retail Sales data tomorrow. The key level to watch is $4,775 support—a break here could accelerate selling toward $4,698, while a hold could lead to another test of $4,838 resistance. Traders should prioritize capital preservation over aggressive positioning today, as the real volatility will likely arrive with tomorrow's data. Remember, consistent execution across all market conditions separates profitable traders from the rest. Let our AI Trading Bot handle the complex analysis and execution while you focus on strategy—it trades XAUUSD 24/7 with an 83%+ win rate by removing emotion from the equation.
Risk Disclaimer: Trading Gold (XAU/USD) involves significant risk of loss. This content is for informational purposes only and does not constitute financial advice. Always conduct your own research and trade responsibly.