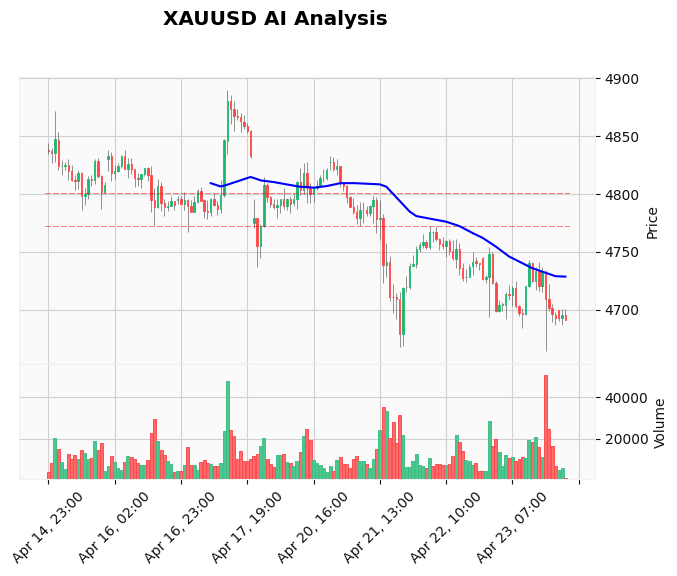
Gold opened the Asian session at $4,695 after a volatile Thursday session that saw a sharp intraday dip to $4,690 before a modest recovery to close near $4,705. The precious metal is currently testing the $4,700–$4,710 resistance zone, and short-term momentum indicators are flashing a potential intraday bounce. However, the daily trend remains firmly bearish, making this a classic 'bear market rally' scenario. For traders looking to capitalize on these moves without staring at screens all day, our AI Trading Bot can automatically execute high-probability setups around key levels.
Gold Market Overview
Sentiment remains fragile. The US Dollar Index (DXY) is holding near recent highs, buoyed by hawkish Fed expectations and higher Treasury yields. Meanwhile, geopolitical tensions between the US and Iran, as well as ongoing conflict in Israel, are providing a floor under gold prices. However, the dominant macro driver continues to be the strength of the greenback, which has pushed XAUUSD below the psychologically important $4,700 level. In early Asian liquidity, price action is thin and choppy, typical of a market awaiting fresh catalysts.
Technical Analysis
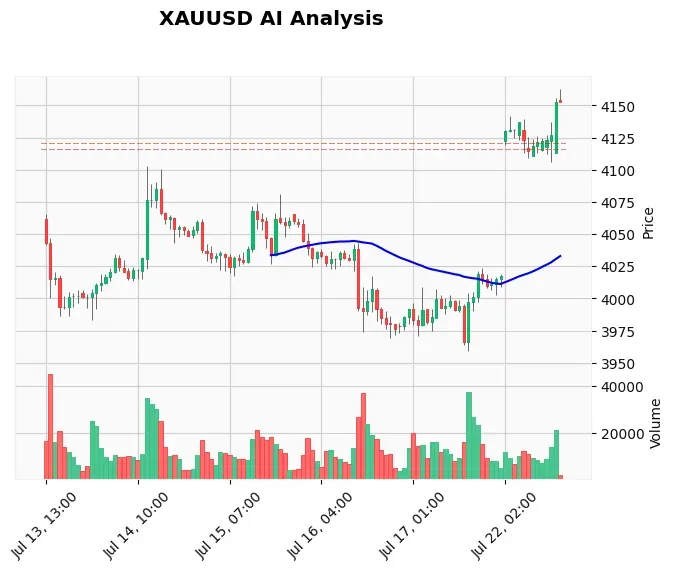
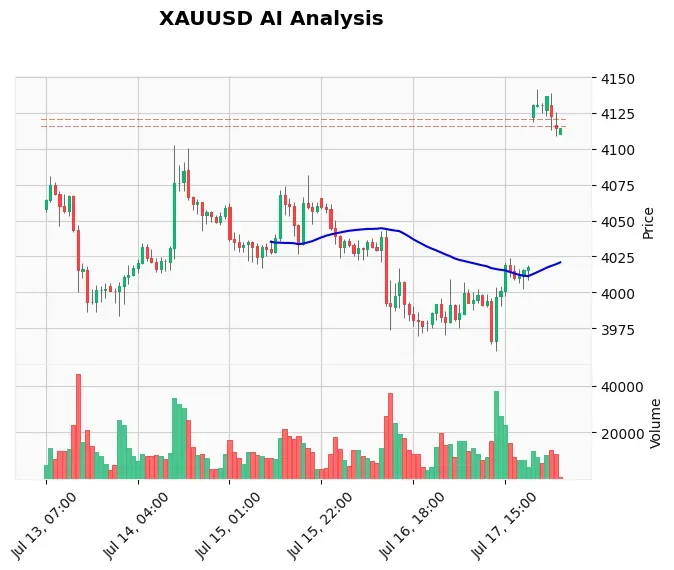
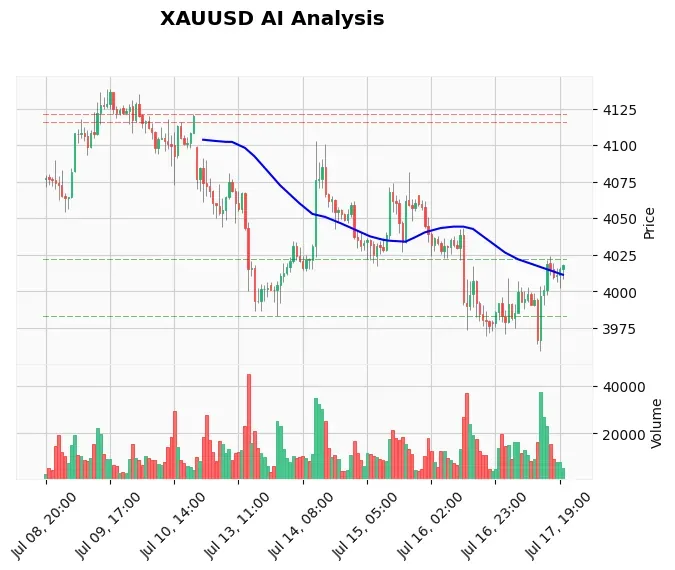
From the latest TradingView data (60-minute chart), the trend is short with price at $4,704.65. The EMA structure is bearish: EMA20 ($4,711.16) is below EMA50 ($4,728.32) and both are well below EMA200 ($4,755.26). RSI sits at 45.48, neutral-bearish, while MACD is negative (-8.57) and below its signal line. Immediate resistance is the $4,700–$4,710 zone, which aligns with the 20-period EMA. A clear break above $4,720 would open the door to $4,737 (S2 on our pivot table) and then $4,755. On the downside, key support rests at $4,670–$4,690, with a break below $4,670 likely accelerating selling toward $4,650. The intraday bounce from $4,690 on the M15 chart shows surging momentum, but it remains corrective within the larger downtrend. For a complete set of technical tools to analyze Gold, visit our Gold technical analysis tools page.
Fundamental Drivers
The primary bearish factor remains a strong US Dollar and elevated bond yields. Market expectations of a prolonged higher-for-longer interest rate environment continue to weigh on non-yielding assets like gold. On the flip side, geopolitical uncertainty—especially the ongoing US-Iran tensions and the Israel conflict—limits downside risk and can spark sudden safe-haven flows. No high-impact economic data is scheduled during the Asian session, so price action will likely revolve around technical levels. To trade news-driven volatility automatically, check our News Trading Bot.
Devil's Advocate
What if the bounce fails? If gold cannot hold above $4,690 during the Asian session, expect an acceleration toward $4,650. A break below that could trigger stop-loss cascades and a retest of $4,600. Conversely, a sustained move above $4,720 would invalidate the immediate bearish bias and could attract short-term dip buyers. Caution is warranted—the trend is still against the bulls.
Trading Strategy for This Session
Given the conflicting timeframes (daily bearish, intraday bullish momentum), we recommend a scalping approach. Consider a long entry on a confirmed bounce from $4,690–$4,695 with a stop loss below $4,680 and take profit at $4,710–$4,715. Alternatively, traders with a bearish bias can wait for a rejection at $4,710–$4,715 to enter a short with a stop above $4,725, targeting $4,685. Because the overall trend is bearish, short positions are preferred above $4,710. For live trade ideas and real-time signals, subscribe to our professional XAU/USD signals.
Risk Management
Gold’s average true range (ATR) on the hourly chart is $20.12, meaning intraday swings can be aggressive. Limit risk per trade to 0.5% of your capital. Use a risk-reward ratio of at least 1:2. For example, a $10 stop should target $20 profit. If the trade moves against you, do not average down—wait for a better setup.
FAQ
Why is gold testing $4,700 again during Asian session?
The $4,700 level is a psychological and technical resistance. The short-term bounce from $4,690 pushed price back to this round number, which often acts as a magnet. Momentum indicators on the M15 chart are positive, but the larger trend is bearish, so price is likely to face selling pressure near $4,700.
What is the key support level for XAUUSD today?
The immediate support is $4,690 (recent intraday low), followed by $4,670 (support from webhook data and prior swing low). A break below $4,670 would expose $4,650 and then $4,600.
Can gold break above $4,720 today?
Possible but less likely given the bearish EMA structure. For a breakout to happen, we need a catalyst such as a sudden geopolitical headline or a weakening dollar. Without one, expect resistance to hold in the $4,710–$4,720 zone.
How does the DXY affect gold during Asian hours?
The Dollar Index (DXY) tends to set the tone for gold during Asian trading because liquidity is lower. A strong DXY keeps gold under pressure, while a weak DXY can trigger a rally. Currently, DXY is firm, aligning with the bearish bias in XAUUSD.
Conclusion
The XAUUSD Asian session outlook for April 24 is defined by a bearish daily trend but short-term momentum pushing price toward key resistance at $4,700. The best trade setup is to sell on strength near $4,710–$4,720, with a stop above $4,725 and a target at $4,685. If you prefer to automate your Gold trading and avoid emotional decisions, consider using our AI Trading Bot—it runs 24/7 on XAUUSD with an 83%+ win rate and executes precisely around the levels we discuss.
Trading Gold (XAU/USD) involves significant risk of loss. This content is for informational purposes only and does not constitute financial advice. Always conduct your own research and trade responsibly.