Gold Price April 23 2026 New York Session: Rally or Trap?
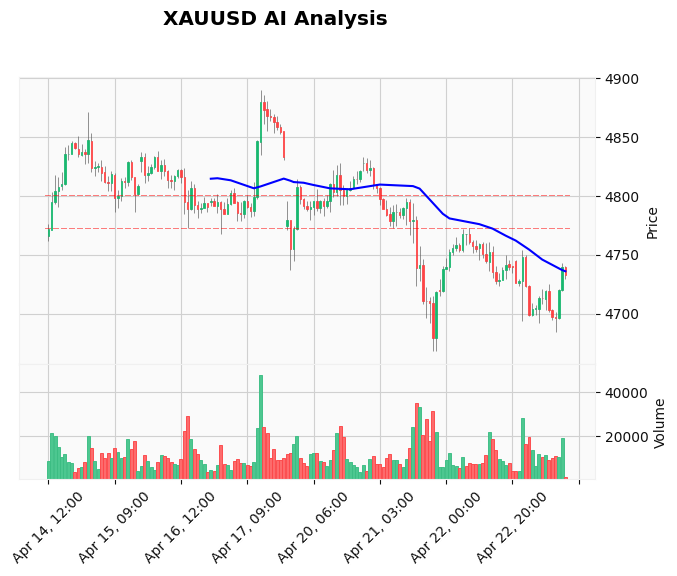
The New York session opened with a sharp intraday bounce in XAUUSD, lifting gold from an overnight low of $4,723.84 to a current bid of $4,732.63. This sudden surge on the M15 timeframe has caught many short sellers off guard, but the overarching daily bearish structure remains intact. As we assess the Gold price April 23 2026 New York session, traders must decide whether this is the start of a more significant recovery or a classic bear flag that will lure in bulls before another leg lower. Want to trade these swings without watching every tick? Our AI Trading Bot automates the entire process with an 83%+ win rate on XAU/USD.
Gold Market Overview
Market sentiment remains fragile. The US Dollar Index is holding near recent highs, fuelled by expectations that the Federal Reserve will keep rates elevated through September. Meanwhile, oil prices are spiking on escalating Iran conflict headlines, stoking inflation fears that ironically weigh on gold by reinforcing the “higher for longer” narrative. No high-impact US economic releases are scheduled for this session, leaving technicals and geopolitical headlines to drive price action. Gold’s intraday bounce should be viewed with caution—the fundamental backdrop remains bearish, and the rally lacks clear catalyst conviction.
Technical Analysis
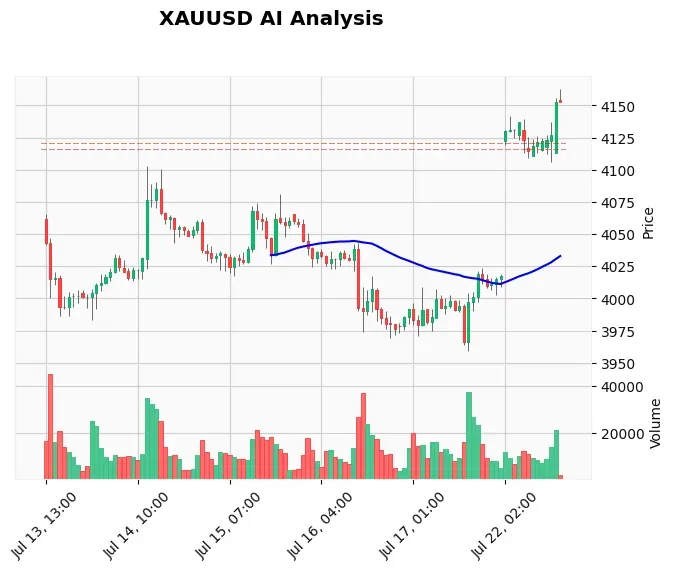
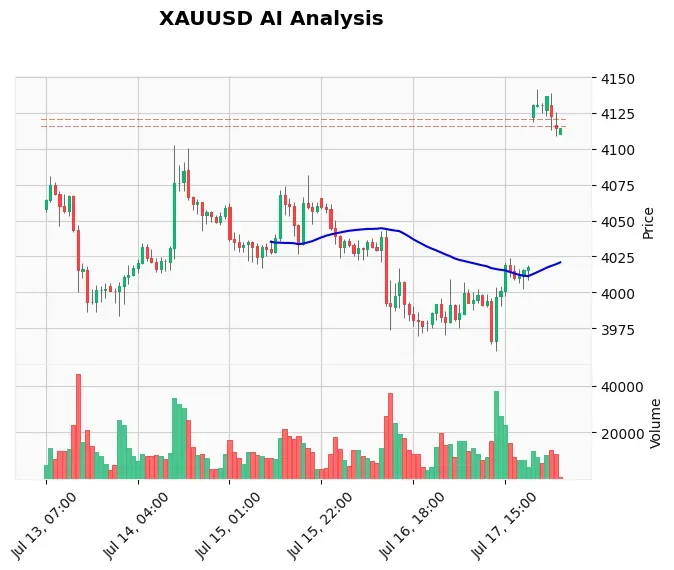
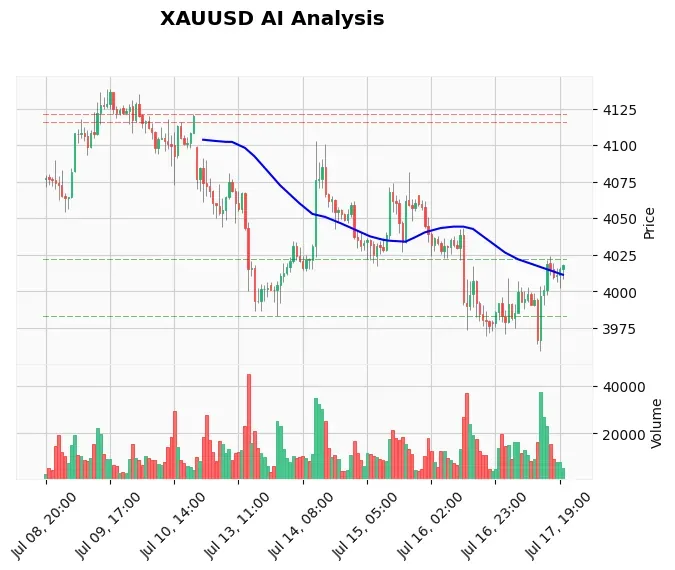
On the hourly chart, price is testing the EMA20 at $4,721.82 after a strong rejection from the $4,723 area. The EMA50 at $4,738.93 and EMA200 at $4,760.26 form a descending resistance band. RSI sits at a neutral 49.49, giving no overbought or oversold extremes. MACD is still negative (-6.82) but the signal line (-9.62) has begun to curl, suggesting slowing bearish momentum. ATR of 18.80 indicates above-average volatility—this is a market that can snap either direction quickly.
Key levels to watch: immediate resistance at the S2 level of $4,737.07 (which flips to resistance after the overnight breakdown), followed by $4,750 and $4,760. On the downside, support is at $4,724 (session low) then $4,700 and the S1 level of $4,668.52. A clean break above $4,738 could trigger short covering toward $4,760, but failure to hold the current bounce would expose $4,700 again. The chart is available for subscribers inside our gold technical analysis tools.
Fundamental Drivers
The primary driver today is the ongoing US-Iran conflict. Oil’s surge has pushed inflation expectations higher, but gold is struggling to attract safe-haven flows because investors are pricing in the Fed’s response: rates staying high. According to the latest Reuters poll, markets expect the ECB to raise rates in June, a move that would further strengthen global yields. For now, gold is caught between geopolitical support and monetary policy headwinds. The next potential catalyst is any FOMC commentary or US-Iran ceasefire headlines. Our News Trading Bot can instantly react to such events while you sleep.
Devil's Advocate
What if this bounce is the start of a larger reversal? The M15 surge is undeniably strong, and a close above $4,738 would invalidate the immediate bearish bias. Traders who stick with shorts must respect the $4,750 handle—a firm break above that level would suggest the daily downtrend has paused and could lead to a retest of $4,800. Conversely, if the rally stalls at $4,737 and price fails to hold above $4,724, the bears will regain full control.
Trading Strategy for This Session
Given the conflicting signals (daily bearish vs. short-term bullish), the prudent approach is to stay on the sidelines until the next clear level breaks. Scalpers can attempt a long entry on a confirmed close above $4,738 with a stop at $4,720 and a first target of $4,755, but this carries high risk. For swing traders, waiting for a bearish rejection near $4,738 or a breakdown below $4,724 offers a better risk-reward ratio. If you prefer a completely mechanical approach, our Price Action Pro EA executes precision entries based on market structure and order flow.
Risk Management
With ATR at 18.80, a 1% stop on a standard mini lot would be about 18.8 points – that’s acceptable but leaves little room for noise in this volatile session. Use a stop no tighter than 15 points if trading the breakout, and reduce lot size accordingly. The 1:2 risk-reward ratio should be your minimum. If the trade goes against you immediately, do not average down; the market is telling you the short-term momentum is stronger than expected.
FAQ
Q: Is gold bullish or bearish today in the New York session?
A: Short-term momentum is bullish on the minutes chart, but the daily timeframe remains bearish. The bias is bearish unless a clear break above $4,760 occurs.
Q: What is the key resistance level for XAUUSD today?
A: Immediate resistance is at $4,738 (S2 level turned resistance), followed by $4,750 and $4,760 (EMA200).
Q: Why is gold not rallying despite the Iran conflict?
A: Safe-haven flows are being offset by a stronger US dollar and expectations that the Fed will keep rates high to combat war-driven inflation.
Q: What trading bot can help me trade gold automatically?
A: Our AI Trading Bot trades XAUUSD 24/7 with an 83%+ win rate and requires no manual intervention.
Conclusion
The Gold price April 23 2026 New York session is a classic conflict: intraday bulls trying to reclaim lost ground vs. a heavy macro backdrop that favours the bears. The next few hours will tell the story. A close above $4,738 opens the door to $4,760, but a failure to hold $4,724 likely sends us back to $4,700 or lower. Be patient and let the market prove itself. For traders who want to capitalize on these moves without emotion, our AI Trading Bot provides automated entry and exit based on the same data we monitor.
Trading Gold (XAU/USD) involves significant risk of loss. This content is for informational purposes only and does not constitute financial advice. Always conduct your own research and trade responsibly.