Gold Price Forecast April 23 2026 Asia Open: Bears Test $4,737 Support
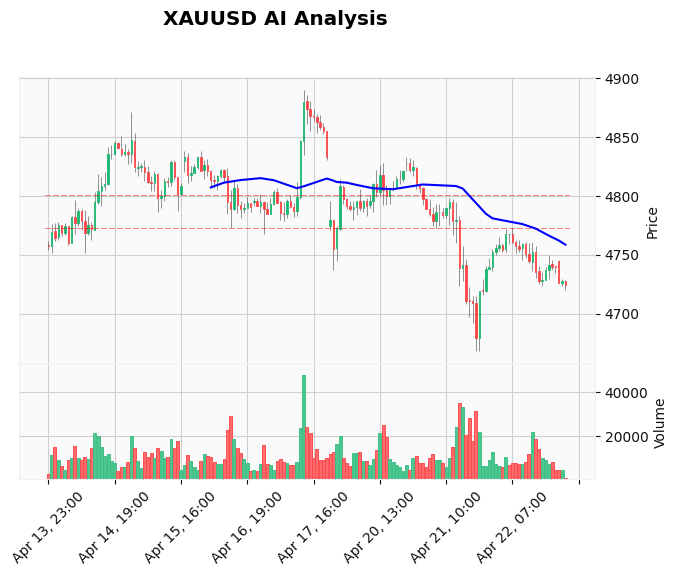
The Gold price forecast April 23 2026 Asia open centers on a critical technical battle at the $4,737 support level. XAUUSD opens the Asian session at $4,748, having bounced from an overnight low of $4,694. The market is trapped within a descending triangle on the hourly chart, with resistance near $4,747 and the lower boundary at $4,718. A break below $4,737 would signal a bearish continuation towards $4,700, while a hold above could trigger a retest of the $4,747-$4,753 zone. For traders looking to capitalize on this high-stakes breakout without constant screen time, our AI Trading Bot executes these precise technical setups 24/7 with an 83% win rate.
Gold Market Overview
The Asian session opens with a tense equilibrium. Gold is caught between opposing fundamental forces, resulting in the tight range-bound action we see this morning. On one side, the ongoing Iran war continues to provide a solid underlying bid for gold as a safe-haven asset. The Pentagon's report of 400 U.S. wounded is a stark reminder of the conflict's human cost and its potential to escalate. However, this bid is being effectively capped by a stronger US Dollar, which has gained as central banks adopt a wait-and-see posture. Lower US Treasury yields would typically support gold, but the dollar's strength is currently the dominant driver, leading to cautious, range-bound price action. With no high-impact USD data on the immediate horizon, the market is likely to be driven by technicals and sentiment shifts during the quieter Asian hours.
Technical Analysis
The technical picture presents a clear roadmap for Asian session traders. The price is currently sandwiched between the 20-period EMA at $4,742.35 and the 50-period EMA at $4,756.69, indicating short-term consolidation within a broader bearish structure, as the 200-period EMA sits overhead at $4,766.92. The key level from our live TradingView data is the $4,737.07 support (S2). A decisive hourly close below this level would confirm a breakdown from the current consolidation and open a path toward the next major support at $4,668.52 (S1). The RSI reading of 51.2 is neutral, offering no strong directional bias, while the MACD remains in negative territory at -5.82, albeit with a slight convergence toward its signal line. The Average True Range (ATR) of 18.95 points to moderate volatility, suggesting a breakout from the current $4,718-$4,753 range could produce a swift 20-30 point move.
Fundamental Drivers
Two primary narratives are wrestling for control of gold's direction. First, the geopolitical risk premium from the Iran war remains intact. Headlines confirming extended casualties keep the fear of a broader regional conflict alive, which supports gold's traditional role as a crisis hedge. Second, and currently winning the tug-of-war, is the strength of the US Dollar. Market intelligence suggests the dollar is gaining as traders anticipate potential policy shifts from the Federal Reserve under political pressure, overshadowing the supportive effect of lower yields. This creates the classic 'risk-off but dollar-up' environment that often caps gold's upside. For traders who want to automate their reaction to these fast-moving news events, our News Trading Bot is designed to scan headlines and execute trades within milliseconds of a major release.
Devil's Advocate
While the structure favors the bears, a bullish reversal scenario is not off the table. The key level that would invalidate the immediate bearish outlook is a sustained break above the descending triangle resistance and the recent swing high at $4,747. Such a move would likely trigger a short squeeze, pushing price toward the next significant resistance at $4,838.31 (R2). The fundamental catalyst for this could be an unexpected escalation in Iran, such as a direct strike on U.S. assets, which would cause a flight to safety that overwhelms dollar strength. Alternatively, a sudden dovish shift in Fed rhetoric could weaken the dollar and unleash gold's pent-up bullish energy. Traders must respect this level; a break above it changes the narrative from 'sell the rallies' to 'buy the dips.'
Trading Strategy for This Session
The Asian session strategy is one of patient preparation for a breakout. The most defined setup is a bearish continuation play. Entry Zone: A sell stop order can be placed just below the key $4,737 support, around $4,735, anticipating a breakdown. Stop Loss: This should be placed above the triangle resistance and the recent high at $4,747, providing a logical invalidation point. Take Profit: The first target is the psychological $4,700 level, with a secondary target at $4,685, aligning with the triangle's measured move. The risk-reward ratio on this setup exceeds 1:2. For traders who prefer a rules-based approach to such technical patterns, our Price Action Pro EA specializes in identifying and trading these exact consolidation breakouts automatically.
Risk Management
In a low-volatility, range-bound Asian session, position sizing is critical. Risk no more than 1% of your account capital on this single setup. Given an approximate 12-point risk (from $4,735 to $4,747), adjust your lot size accordingly. If the trade is triggered and moves in your favor, consider moving your stop loss to breakeven once price reaches the $4,720 area, protecting capital. If the trade fails and the stop loss is hit, do not re-enter immediately. Wait for price to show clear directional conviction, either with a close back above $4,750 or a renewed rejection below $4,730. Discipline in accepting small losses is what preserves capital for the high-probability setups.
Frequently Asked Questions (FAQ)
Q: Why is gold not rising despite the Iran war?
A: Gold is facing conflicting forces. While geopolitical tension provides support, a stronger US Dollar is applying significant downward pressure. The market is in a wait-and-see mode, balancing these two factors, which results in range-bound trading until one driver becomes dominant.
Q: What is the most important level for gold today?
A: The $4,737 level is the most critical short-term support. A break below it targets $4,700. Conversely, resistance at $4,747 is the level bulls must conquer to shift momentum back in their favor.
Q: Is now a good time to buy gold for the long term?
A: Long-term fundamentals, including central bank buying and geopolitical uncertainty, remain supportive. However, short-term traders should focus on the technical range between $4,737 and $4,747. A dip toward $4,700 could offer a better long-term entry point for investors.
Q: How does the US Dollar affect gold price?
A: Gold is priced in US Dollars. A stronger dollar makes gold more expensive for holders of other currencies, which can reduce demand and push the price lower. This inverse correlation is a key dynamic, often overriding other supportive factors in the short term.
Conclusion
The Asian session sets the stage for a potential directional move. Gold's fate hinges on the $4,737 support. A breakdown here would confirm bearish control and target the $4,700 area, aligning with the broader daily chart structure. A hold above this level, followed by a push through $4,747, would signal that bulls are gathering strength for a counter-attack. The quiet session is ideal for preparing orders and managing existing positions, not for impulsive trades. To execute this precise breakout strategy consistently, consider leveraging our best-selling Gold trading bot, which removes emotion and operates on pure technical logic around the clock.
Risk Disclaimer: Trading Gold (XAU/USD) involves significant risk of loss. This content is for informational purposes only and does not constitute financial advice. Always conduct your own research and trade responsibly.