XAU/USD Price Movement May 22 London Open: Momentum Builds Toward $4,580 Resistance
The XAU USD price movement May 22 London open reveals a market at a crossroads. After a sharp bounce from the $4,480 support zone during Asian hours, gold now trades near $4,522, with short-term momentum surging on the M15 timeframe. The daily trend remains bearish, but this intraday retracement is testing key resistance levels ahead of the European cash open. Traders should watch the $4,580 resistance area closely — a clean break could shift the bias, while a rejection would confirm the broader downtrend. Want to trade this setup automatically? Our AI Trading Bot runs 24/7 on XAU/USD with an 83%+ win rate.
Gold Market Overview
The European session opens with a mixed risk tone. The US Dollar remains supported by hawkish Federal Reserve expectations, keeping a lid on gold’s upside. Meanwhile, Iran-related uncertainties provide a safe-haven bid, preventing further losses. The net effect is a consolidation phase. No high-impact US economic releases are scheduled today, so technical levels and order flow will drive intraday action. The DXY is holding near recent highs, which typically pressures gold, but the metal’s resilience around $4,480 suggests buyers are stepping in.
Technical Analysis
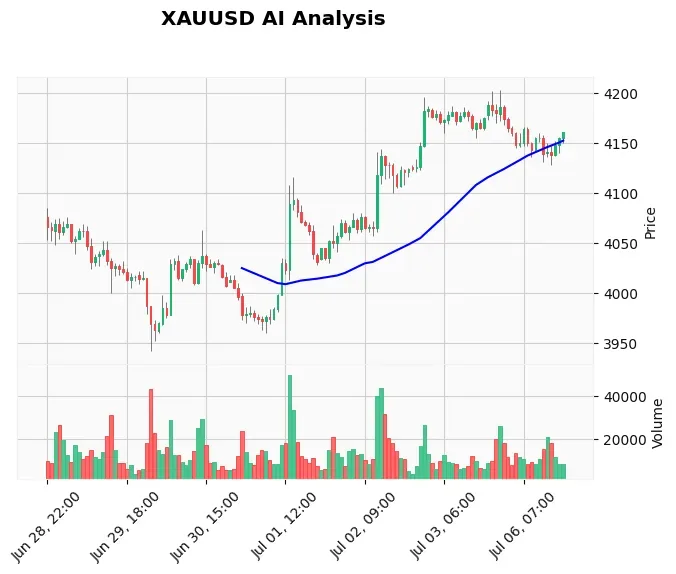
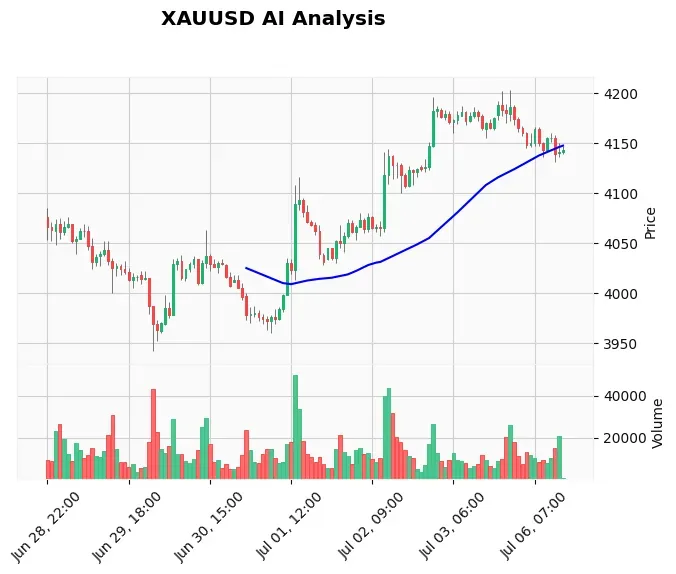
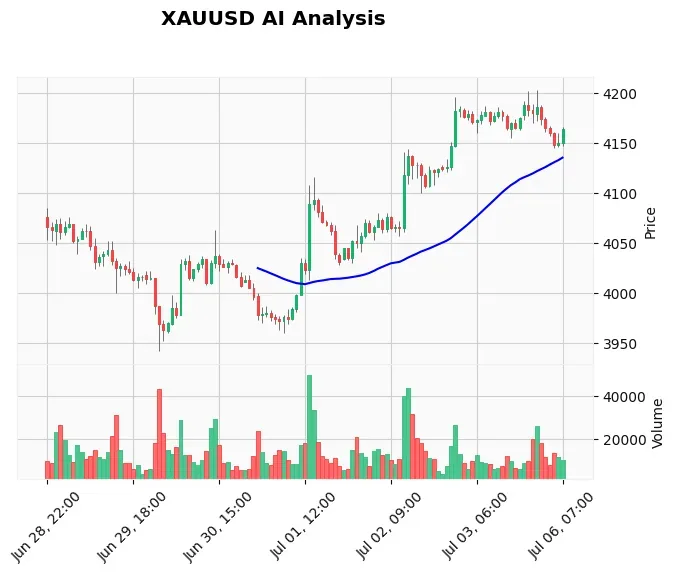
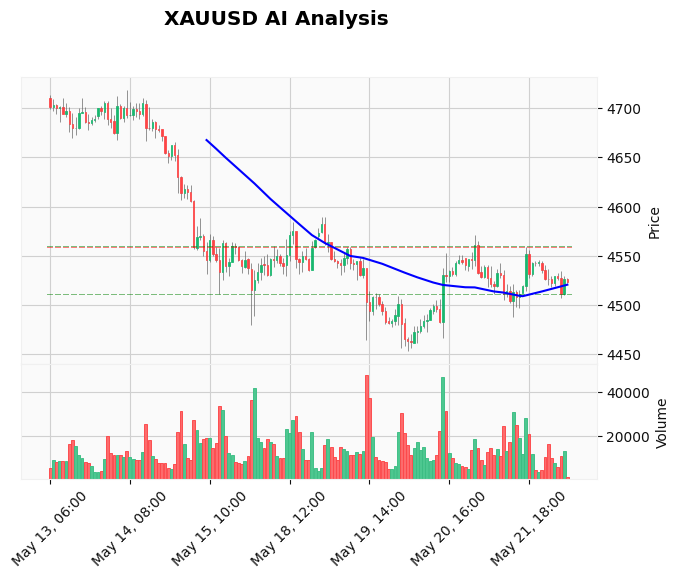
Looking at the H1 chart, price action has staged a clean bounce from the $4,480 support level (S2 from our TradingView webhook) and is now retesting the EMA20 ($4,526) and EMA50 ($4,526) confluence. The EMA200 sits far above at $4,573, underscoring the bearish long-term structure. The Relative Strength Index (RSI) reads 48.16 — neutral, but recovering from oversold territory. MACD is still negative (-0.15) but the signal line is positive (1.38), hinting at a potential bullish crossover. The Average True Range (ATR) of 16.64 suggests normal volatility for this session.
Immediate resistance is at $4,571 (R1), followed by the major resistance zone near $4,589 (R2). On the downside, support lies at $4,480 (S2) and then the stronger $4,454 (S1). A daily close above $4,580 would signal a possible trend reversal, while a failure to hold $4,500 could trigger a revisit of $4,480. Chart analysis confirms a sharply rising momentum on the M15, but the higher timeframe trend remains bearish. For daily charts and automated signals, consider our Gold technical analysis tools.
Fundamental Drivers
The fundamental backdrop is uninspiring for gold bulls. Hawkish Fed rhetoric continues to underpin the US dollar, capping gold rallies. On the geopolitical front, US-Iran negotiations show a breakthrough, according to some reports, but uncertainty remains high. India’s gold demand is also under pressure due to the Iran war impacting remittances. With no tier-one data today, the market will trade on technicals and headline risk. For traders who want to capture volatility around news events, the News Trading Bot can automatically trade high-impact releases.
Devil’s Advocate
Despite the bounce, this move could be a bear flag before another leg lower. If gold fails to clear the EMA20/50 confluence zone ($4,526) and prints a lower high, sellers could step in aggressively. A break below $4,500 would likely trigger stop-losses and accelerate selling toward $4,480. Also, any hawkish Fed commentary during the European afternoon would strengthen the dollar and weigh on gold. The neutral trend from our webhook suggests traders should not commit to a direction yet.
Trading Strategy for This Session
Given the neutral bias and surging micro momentum, the best approach is a scalping strategy on the 15-minute chart until a clear breakout occurs. Look for a long entry if price reclaims $4,530 with a strong candle, targeting $4,558 (just below R1). Stop loss at $4,510. Alternatively, a rejection at $4,530 could offer a short entry toward $4,500. For a systematic approach, you can use our Gold trading EAs that execute these setups automatically.
Risk Management
Position sizing is critical in this low-volatility, choppy environment. Risk no more than 1% of your capital per trade. With the ATR at 16.64, a stop loss of 10-12 pips is tight but acceptable for scalping. If the trade moves against you, do not average down — wait for the next setup. The key is to avoid trading the false breakout around the $4,530 resistance area. Patience pays.
FAQ
Is gold going to $4,500 today?
Gold is currently trading above $4,500, so a retest of $4,500 is possible during the London session if selling pressure increases. However, the bounce from $4,480 shows buyers are defending that level. Watch $4,530: a break above could push gold toward $4,580, while a rejection keeps $4,500 in play.
What is the gold price prediction for May 22?
Based on technical levels, gold is expected to trade between $4,480 and $4,580 on May 22. The neutral RSI and converging moving averages suggest a breakout is coming, but the direction remains unclear. Fundamentals favor the dollar, so downside risk remains.
How to trade London open gold?
Focus on the first hour after the London cash open. If gold opens above $4,530, look for a long move toward R1. If it opens below $4,510, short trades targeting $4,480 are favorable. Use a 15-minute chart and strict stop loss. For hands-off execution, consider Price Action Pro EA.
What are the key support and resistance for XAU/USD today?
Support: $4,500 (psychological), $4,480 (S2). Resistance: $4,530 (EMA20/50), $4,571 (R1), $4,589 (R2).
Conclusion
The XAU USD price movement May 22 London open offers a clear opportunity: either a breakout above $4,530/$4,580 or a breakdown below $4,500. The micro momentum is bullish, but the higher timeframe trend says sell. Stick to your trading plan, manage risk, and let the market reveal its hand. If you prefer a completely automated approach, our best-selling Gold trading bot can take the guesswork out of your day — set it and forget it.
Risk Disclaimer: Trading Gold (XAU/USD) involves significant risk of loss. This content is for informational purposes only and does not constitute financial advice. Always conduct your own research and trade responsibly.