How to Use Support and Resistance in Gold Trading: A Complete Guide
Every Gold trader has felt the pain of buying at the top or selling at the bottom — only to watch the market reverse instantly. The difference between a beginner and a professional often comes down to one skill: correctly identifying support and resistance. In XAU/USD, where price moves $20–$50 per session, missing a key level can cost you your entire risk budget. Support and resistance are the foundation of price action trading. They tell you where buyers step in, where sellers take control, and when a breakout is real. By the end of this guide, you will know exactly how to spot, draw, and trade these levels on Gold charts. Want to trade these levels automatically? Our AI Trading Bot identifies and executes support/resistance breakouts on XAUUSD with an 83%+ win rate — no manual charting required.
What Are Support and Resistance?
Support is a price level where buying pressure is strong enough to stop a downtrend and push prices higher. Resistance is the opposite — a level where selling pressure halts an uptrend and forces prices lower. Imagine a floor (support) and a ceiling (resistance). When price bounces off a support level, traders expect a move back toward resistance. When price breaks through resistance, that level often becomes new support. This concept works across all timeframes, from the 1-minute chart to the weekly chart. In Gold, support and resistance levels are particularly reliable because the metal attracts both institutional and retail traders, creating well-defined zones where big orders cluster. A level becomes stronger the more times it is tested without being broken. If Gold touches $2350 support four times in two weeks, that level is far more significant than a one-time touch.
Why Support and Resistance Matters for Gold Traders
Gold trades differently from forex pairs like EUR/USD. Its price is driven by macroeconomic events, central bank policies, and geopolitical fear — but it still respects technical levels with impressive accuracy. For example, round numbers like $2000, $2100, and $2200 have acted as psychological magnets for years. In May 2026, Gold is trading near $2375, with clear support at $2350 and resistance at $2400. Knowing these levels helps you: set precise entry and exit points, place stop-loss orders beyond key levels (protecting against false breakouts), identify when a trend is about to reverse (e.g., failure to break resistance signals exhaustion), and manage risk-reward ratios effectively because you can measure the distance to the next level. Without support and resistance, you are trading blind — reacting to every tick instead of planning around high-probability zones.
How to Draw Support and Resistance Levels Step by Step on XAUUSD
Drawing support and resistance on Metal charts is straightforward if you follow a consistent method. Here is the process I teach to every student.
Step 1: Open a Daily Chart. Use MT4, MT5, or TradingView. Switch to the daily timeframe on XAUUSD. This timeframe gives you the most reliable levels because it filters out intraday noise. Look for clear swing highs (peaks) and swing lows (troughs).
Step 2: Identify Major Swing Points. Scan the last 30–50 daily candles. Mark the highest high of each upward move and the lowest low of each downward move. The more obvious the swing, the better. For instance, in early May 2026, Gold formed a swing low at $2330 before rallying to $2390. That $2330 level becomes a support zone.
Step 3: Draw Horizontal Lines. Click the horizontal line tool. Draw a line at the exact price of each swing high and swing low. Extend the lines to the right. Pay special attention to levels where multiple swings cluster — for example, a resistance zone at $2410 that has been tested three times in the past month.
Step 4: Add Round Numbers. Gold traders love psychological levels. Add lines at every $100 increment (e.g., $2300, $2400, $2500). Also add $50 midpoints ($2350, $2450) because price often stalls there. These zones act as magnets.
Step 5: Validate with Volume or Indicators. If your platform shows volume, check whether a level was tested with high volume — that confirms its importance. Alternatively, use the 50-period moving average. In Gold, the 50 EMA often aligns with support/resistance zones, adding confluence.
Once you have 6–8 key levels on your daily chart, zoom into the 4-hour or 1-hour chart for finer levels to time entries. Always trade in the direction of the higher timeframe level. If daily resistance is at $2400 and price approaches it, wait for a bounce before shorting, or a clean breakout above $2410 before going long.
Common Mistakes Gold Traders Make with Support and Resistance
Mistake 1: Drawing Too Many Levels. A chart covered in lines is useless. Stick to the most significant 5–7 levels. Remove lines after they are broken and retested.
Mistake 2: Ignoring the Timeframe Context. A support level on the 5-minute chart means little if the daily chart shows resistance just above. Always align your intraday levels with the daily bias.
Mistake 3: Trading Breakouts Without Confirmation. Gold often fakes breakouts (false breaks above resistance that reverse quickly). Wait for a daily candle close above resistance or a retest as support before entering. Do not buy the first spike above $2400.
Mistake 4: Not Adjusting for Volatility. Gold can move $30 in a session. A support level you drew at $2350 might be tested but price dips $5 below it and then bounces — that is still a valid support zone. Use a range (e.g., $2345–$2355) instead of a single line.
Mistake 5: Chasing Price After a Breakout. Once support or resistance breaks, the best entry is on the retest, not during the initial breakout. Patience pays. Many traders blow accounts by buying the top of a breakout.
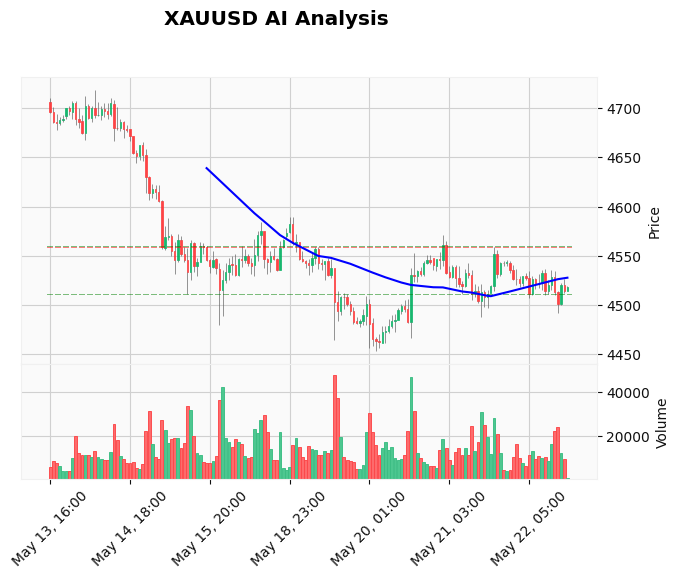
Real Example on XAUUSD Chart – May 2026
Let us apply this to real market context. In mid-May 2026, Gold formed a clear support zone at $2350 after bouncing twice from that level. The resistance above was $2400, tested three times without a daily close above it. A seasoned trader would prepare to buy at $2350 with a stop at $2335 (below the support zone) and a target at $2400 — a 5:1 risk-reward ratio. If price broke and closed above $2400, the next target becomes $2450 (psychological round number). This kind of structured approach separates consistent winners from gamblers. Gold offers these clean setups multiple times per month.
For traders who prefer not to stare at charts all day, our Price Action Pro EA automatically identifies support/resistance zones and places trades with predefined risk rules. It is the perfect complement to manual analysis.
Frequently Asked Questions
How do I know if a support or resistance level is strong?
A level's strength increases with the number of times it has been tested without breaking, the size of the candles at that level (big bodies = strong reaction), and the volume (if available). Also check if the level aligns with a moving average or a Fibonacci retracement. For Gold, the $2000 level is extremely strong because it is a psychological round number and has been tested over 10 times since 2020.
Should I use trendlines or horizontal levels for Gold?
Both work, but horizontal levels (support/resistance) are more objective and easier to trade because they give exact prices for entry, stop, and target. Trendlines can be subjective — different traders draw different lines. Use horizontal levels as your primary tool, then add diagonal trendlines as secondary confirmation.
What happens after a support or resistance level breaks?
When support breaks, it often becomes resistance (the floor becomes the ceiling). When resistance breaks, it becomes support. This role reversal is a key concept. For example, if Gold breaks above $2400 resistance, that level becomes a new support for future pullbacks. Wait for a retest of the broken level before entering in the direction of the breakout.
Can I combine support/resistance with other indicators?
Yes. RSI divergence at support strengthens a buy signal. MACD crossing above the signal line near a resistance breakout confirms momentum. The 50 EMA often acts as dynamic support/resistance. Combining confluences increases your win rate. However, do not overload your chart — start with price action levels, then add one or two indicators for confirmation.
Conclusion
Support and resistance are the backbone of profitable Gold trading. They give you a structured way to read the market, manage risk, and stay disciplined. Instead of reacting to every move, you will wait for price to reach a known level and act with confidence. Start by drawing 5–7 key levels on the daily chart, then practice on the 4-hour and 1-hour timeframes. Over time, you will develop an intuition for where Gold wants to go. The best traders do not predict — they react to levels. Ready to take your Gold trading to the next level? Try our AI Trading Bot and let advanced algorithms execute support/resistance strategies for you 24/7. Follow our daily Gold signals to see real-time examples of level-based trading.
Risk Disclaimer: Trading Gold (XAU/USD) involves significant risk of loss. This content is for informational purposes only and does not constitute financial advice. Always conduct your own research and trade responsibly.