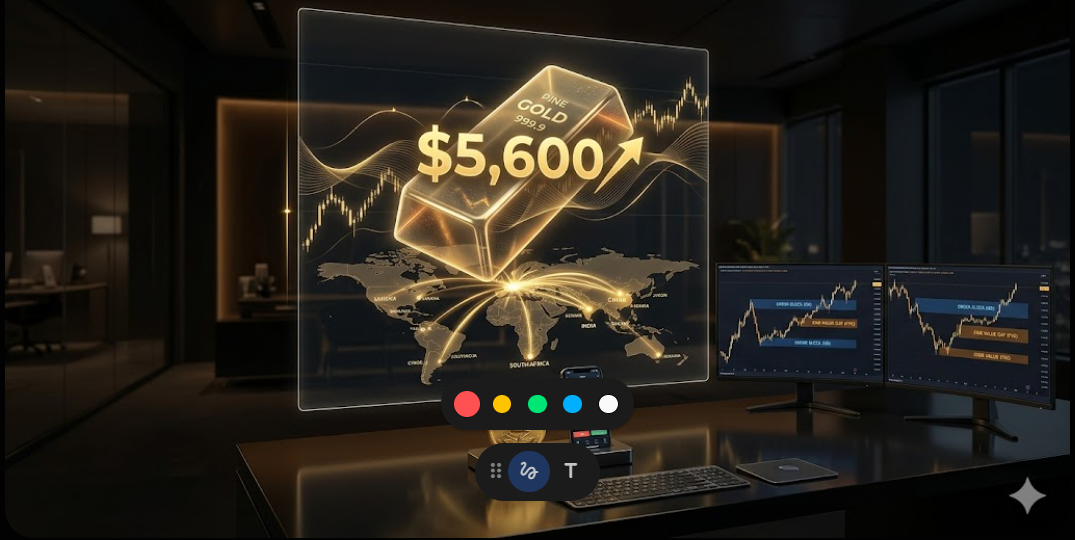
The financial landscape of 2026 has witnessed an unprecedented evolution in the precious metals market, specifically within the trading of Gold (XAUUSD). As the global economy grapples with shifting reserve currencies and structural inflation, Gold has transitioned from a mere defensive hedge into the primary arena for institutional price discovery. For the modern trader, navigating this environment requires more than a passing familiarity with technical indicators; it demands a profound mastery of price action—the study of raw price movement as the ultimate reflection of market psychology and institutional intent. In an era where algorithms execute millions of trades per second, the "naked chart" remains the only unfiltered narrative of the battle between buyers and sellers, offering the clarity necessary to survive and thrive in a market that recently breached the $5,600 milestone.
Core Principles: The Philosophy of Naked Chart Trading
Price action trading is founded on the core belief that price movement is the definitive footprint of all available information, sentiment, and market psychology. At its most fundamental level, this methodology involves analyzing the historical and current price movements of an asset, displayed on a chart without the distortion of lagging indicators like moving averages, RSI, or MACD. The senior mentor's approach to this philosophy is to view the chart as a living story of human behavior. Every tick, every candle, and every swing level is a word in that story, revealing the commitment of buyers or the exhaustion of sellers in real-time. This "naked" philosophy emphasizes that everything a trader needs to know is already reflected in the price itself; indicators are merely derivatives of this primary data and often lag behind the actual shifts in market power.
Market psychology serves as the internal engine of price action. In the 2026 Gold market, where geopolitical tensions involving major world powers and shifting central bank reserves create high-stakes environments, psychology is the primary driver of the massive price spikes and rapid rejections observed on the charts. The mentor views a trader as a detective at a crime scene, where the raw price chart provides the physical evidence of institutional moves. While indicators act like second-hand witness reports—often unreliable and delayed—the price action itself provides the unfiltered truth. This relationship with the market is essential because it removes the noise and cognitive overload associated with complex, indicator-heavy systems, allowing for faster and more confident decision-making during periods of extreme Gold volatility.
Clarity and simplicity are not just stylistic choices; they are strategic advantages in professional trading. By stripping away indicators, the trader can focus on the most important information: where the "Big Players"—the global banks and sovereign institutions—are likely placing their orders. This direct relationship with price movement enables a trader to adapt to any market condition or timeframe, as the universal principles of supply, demand, and human psychology remain constant regardless of the asset being traded. For those looking to bridge the gap between discretionary price action and modern automation, tools such as the Price Action Pro EA have become essential, as they are designed to detect these pure price patterns and support/resistance zones automatically, allowing traders to execute based on institutional-grade logic without the constant need for manual monitoring.
| Core Principle | Description and Rationale | Psychological Insight |
|---|---|---|
| Naked Charting | Trading without secondary indicators to see raw price behavior. | Reduces cognitive bias and "analysis paralysis". |
| Price as Truth | The belief that price reflects all known news and fundamental shifts. | Aligns the trader with the reality of the tape, not the theory of an indicator. |
| Universal Language | Price action patterns repeat across all timeframes and assets. | Relies on the fact that human behavior—and thus market patterns—repeats. |
| Real-Time Data | Price action provides immediate feedback on market shifts. | Enables rapid reaction to high-volatility events like FOMC or geopolitical news. |
Identifying Support and Resistance Levels with Precision on Gold
In the context of Gold trading in 2026, support and resistance levels are no longer viewed as static lines but as dynamic "zones" of historical significance where price action has previously reversed or paused. A support level is a price area where the forces of demand are strong enough to prevent the price from falling further, while a resistance level is an area where supply outstrips demand, stalling an upward move. Identifying these zones with precision on Gold is an art that requires a top-down approach, starting with higher timeframes like the daily and weekly charts to find the levels that truly matter to institutional participants.
Precision in identifying these levels involves marking previous swing points—the peaks and troughs where the market has decisively changed direction. In an uptrend, old resistance levels that have been broken often flip to become "new support," as institutional players look to re-enter positions at a previously established high-value zone. For Gold traders, psychological round numbers play an outsized role in this process. Throughout 2026, the $5,000 level has served as a massive psychological hurdle, acting as a "line in the sand" for market sentiment. Other critical levels identified in the 2026 landscape include the $4,800 long-term support area and the $5,600 record high resistance zone.
Professional analysis of Gold also incorporates dynamic levels of support and resistance. Trendlines, drawn by connecting consecutive higher lows in an uptrend or lower highs in a downtrend, act as rising or falling boundaries that price often respects until a structural break occurs. Furthermore, dynamic indicators like the 20-day and 50-day Exponential Moving Averages (EMAs) are frequently respected by Gold price action, serving as "lifelines" during strong trending moves. For traders utilizing the(https://investortipster.com/marketplace/product/ai-trading/), these levels are integrated into a multi-layered analysis that includes fundamental sentiment scraping, ensuring that entries are timed when both technical price action and macro-economic demand align.
| Key Support Levels (Gold 2026) | Price Significance | Actionable Insight |
|---|---|---|
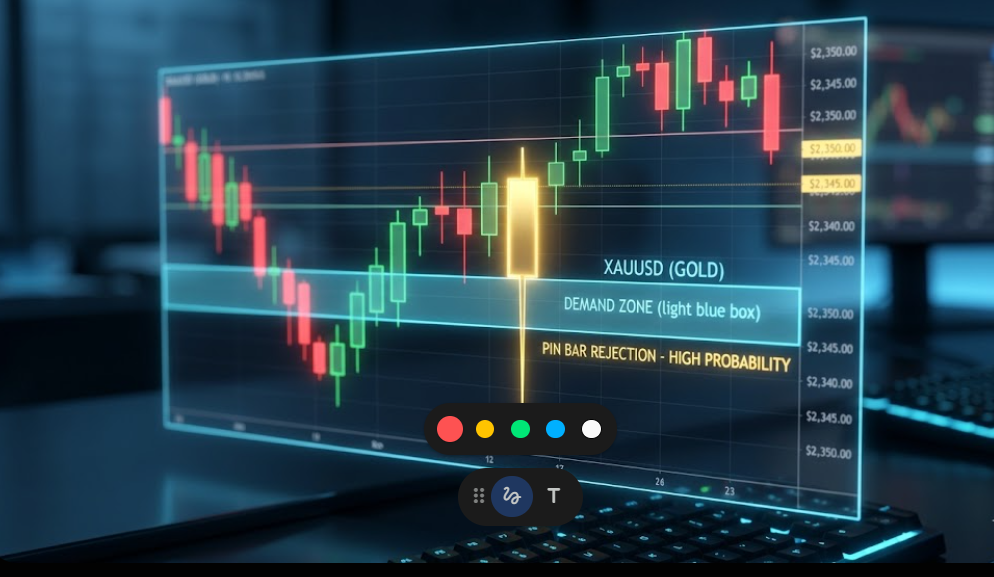
| $5,000.00 | Major psychological support and prior 2026 milestone. | Monitor for strong pin bar rejections to confirm buyer commitment. |
| $4,800.00 | Long-term structural floor and critical technical pivot. | A daily close below this level signals a potential shift to a bearish regime. |
| $4,402.00 | October 2025 high, now acting as primary support. | Retests of this level often provide high-probability entry points for trend followers. |
| $4,000.00 | Ultimate "line in the sand" for the 2026 bull market. | The psychological anchor; breaking this level would invalidate the long-term bull case. |
Market Structure: Higher Highs, Higher Lows, and Trend Exhaustion
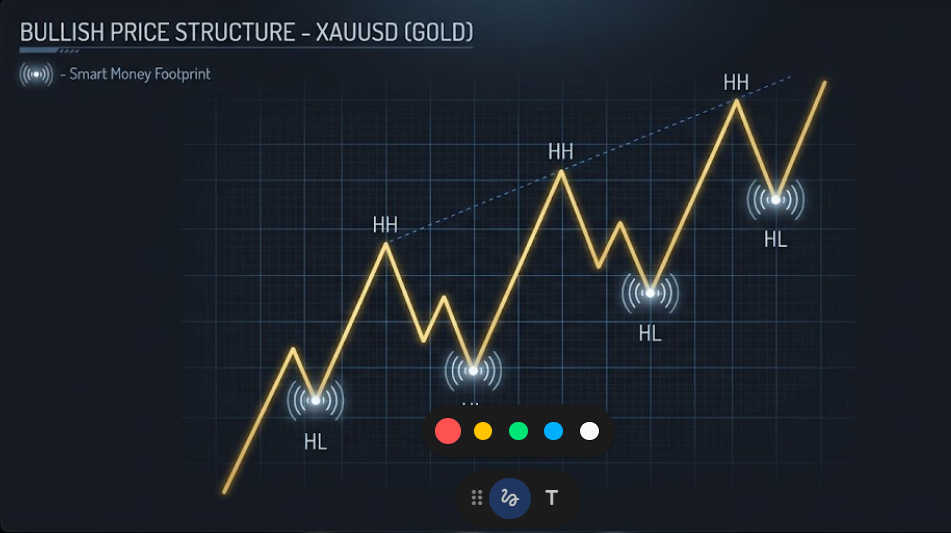
Market structure is the skeletal framework of price action, defining the underlying path of least resistance. To mentor a trader in Gold is to teach them to see the rhythm of the "swings." A bullish market structure is defined by a consistent sequence of Higher Highs (HH) and Higher Lows (HL). This structure signals that buyers are in control and are willing to buy the dips at progressively higher prices, indicating a fundamental imbalance where demand consistently outweighs supply. Conversely, a bearish structure consists of Lower Lows (LL) and Lower Highs (LH), reflecting a market where sellers dominate and every attempt at a rally is met with new selling pressure at lower levels.
Understanding the "Break of Structure" (BOS) is the single most important skill for identifying potential shifts in market power. A BOS occurs when the price moves decisively beyond a previous swing point, such as breaking below the last HL in an uptrend. For the high-conviction Gold trader, a true BOS is confirmed by a full-bodied candle closing beyond the level, rather than just a "wick poke" which often signals a temporary test of liquidity or a stop hunt. In the volatile 2026 sessions, these shifts have often been accompanied by "displacement"—sharp, aggressive price moves that leave behind Fair Value Gaps (FVGs), signaling that institutional "Smart Money" has entered the market with intent.
Trend exhaustion is the phase where the prevailing momentum begins to fade, often preceding a major reversal or a deep correction. Signs of exhaustion on the Gold chart include a noticeable decrease in the size of continuation candles, the appearance of long wicks indicating rejection of higher prices, and the failure of the market to create significant new highs. Professional traders utilize tools like the Relative Strength Index (RSI) to spot "regular divergence"—a situation where Gold price makes a new HH, but the RSI makes a LH, suggesting that the "fuel" behind the move is dissipating. Recognizing these signals allows a mentor to guide a trader to exit positions early or prepare for counter-trend opportunities before the crowd reacts to the visible reversal.
| Structure Type | Identifying Sequence | Strategic Action |
|---|---|---|
| Uptrend | Higher Highs (HH) + Higher Lows (HL). | Focus on buying at the HL zones or breakout pullbacks. |
| Downtrend | Lower Lows (LL) + Lower Highs (LH). | Focus on selling at the LH zones or retests of broken support. |
| BOS (Break of Structure) | Price closes beyond a previous structural high or low. | Confirms a potential trend reversal or significant shift in bias. |
| Exhaustion | Smaller candle bodies, long wicks, and RSI divergence. | Tighten stop losses and reduce position sizing; look for reversal triggers. |
Candlestick Mastery: Pin Bars, Engulfing Patterns, and Dojis
In the high-volatility environment of 2026, candlesticks provide the immediate visual representation of market sentiment and price rejection. Mastery of these patterns is not about memorizing names, but about understanding the psychology of the traders trapped within the candle's wicks. The Pin Bar, or Hammer, is perhaps the most critical pattern in Gold trading. It is characterized by a long wick that makes up at least two-thirds of the total candle length and a small body. A bullish Pin Bar forming at a key support level indicates that sellers tried to drive the price lower, but buyers responded with overwhelming force, creating a "tail" of rejection that signals a potential upward move.
Engulfing patterns provide a clear signal of momentum shift. A Bullish Engulfing pattern occurs when a large bullish candle completely "swallows" the previous bearish candle's body, indicating that buyers have seized control. For Gold traders, these patterns are most effective when they form at the origin of a new move or after a liquidity sweep of a previous session low. Conversely, a Bearish Engulfing pattern at a resistance level warns that a trend has likely reached its peak and that a downward correction is imminent. The mentor teaches that the size of the engulfing candle relative to the preceding ones is a direct measure of the strength of the new momentum.
Doji and Spinning Top candles signal indecision and a balance of power between buyers and sellers. These candles have small bodies and wicks that extend in both directions, showing that neither side was able to achieve a decisive close. In a strong trend, the appearance of multiple Dojis often precedes a "mini shakeout"—a rapid move designed to trap retail traders before the trend resumes or reverses. For traders who prefer an automated approach to these complex patterns, the Price Action Pro EA provides a sophisticated solution by automatically identifying these candlestick formations within the context of larger market structures, ensuring that every trade is backed by sound technical logic.
| Candlestick Pattern | Visual Characteristics | Market Narrative |
|---|---|---|
| Pin Bar (Hammer) | Long wick (2/3+ total length), small body. | Significant price rejection at a key level; "fakeout" signal. |
| Bullish Engulfing | Bullish body completely covers the previous bearish body. | Aggressive takeover by buyers; start of new bullish momentum. |
| Bearish Engulfing | Bearish body completely covers the previous bullish body. | Aggressive takeover by sellers; exhaustion of bullish trend. |
| Doji | Open and close prices are nearly identical. | Perfect equilibrium; warns of potential trend pause or reversal. |
| Marubozu | Long body with little to no wicks. | Extreme conviction and sustained momentum in one direction. |
Advanced Concepts: Supply and Demand Zones vs. Support/Resistance
A nuanced understanding of Price Action involves distinguishing between traditional Support/Resistance and Supply/Demand (S/D) zones. While S/R levels are identified by historical peaks and troughs where price has reacted multiple times, S/D zones focus on the origin of strong, explosive movements. These zones are drawn around the consolidation area—the "base"—immediately preceding a massive impulse move. This base represents an area of institutional accumulation or distribution where huge orders were placed, often leaving behind "unfilled" liquidity that price will eventually return to tap.
Mentoring the transition to S/D trading requires a focus on "Freshness" and "Departure." A "Fresh Zone" is one that has not been revisited since price left it, offering the highest probability of a strong reaction upon its first retest. The strength of the departure—how quickly the price left the zone—is a direct indicator of the imbalance between buyers and sellers; the more aggressive the move, the stronger the zone. In the 2026 Gold market, many high-probability setups were found at "Discount" demand zones (in the lower half of a trading range) where institutional interest is naturally highest.
Traders are taught to look for specific patterns when identifying these zones:
- Rally-Base-Rally (RBR): A continuation pattern where price consolidates before exploding higher.
- Drop-Base-Drop (DBD): A continuation pattern signaling strong bearish momentum.
- Rally-Base-Drop (RBD): A reversal pattern creating a powerful supply zone.
- Drop-Base-Rally (DBR): A reversal pattern creating a powerful demand zone.
Professional management of these zones also involves understanding the "Spring"—a term coined by Wyckoff to describe a false breakout that traps retail traders before the true move occurs. Institutions use the Spring to generate the liquidity needed to fill their large positions, often creating a Pin Bar in the process. By waiting for these zones to be retested and looking for price action confirmation, traders can avoid the common mistake of "chasing" the market and instead enter at the same levels as institutional players.
| Zone Type | Origin Logic | Actionable Strategy |
|---|---|---|
| Demand Zone | Consolidation before a sharp rally. | Look for buy entries upon the first retest of the "base". |
| Supply Zone | Consolidation before a sharp drop. | Look for sell entries upon the first retest of the "base". |
| Fresh Zone | Untested level since its creation. | High-probability setup; institutional orders likely remain. |
| Tested Zone | Level that price has already revisited multiple times. | Lower probability; orders are being "consumed" and the level may break. |
Confluence: Combining Price Action with Volume and Institutional Footprints
The final step in mastering Gold Price Action is the integration of confluence—the alignment of technical signals with institutional footprints. Institutions, due to their massive capital, cannot move in and out of the market without leaving traces. These footprints are visible through "Displacement" (sharp moves that break structure) and "Volume Profile" analysis. A valid breakout in Gold is almost always accompanied by a spike in volume, confirming that major players are participating in the move.
Institutional order flow is the "tone" of the market, revealing whether big players are speaking with conviction or just "whispering". Traders use the Price Action Pro EA to help navigate these footprints, as it is designed to align with "Smart Money Concepts" (SMC), focusing on liquidity sweeps and Fair Value Gaps (FVGs). An FVG is a pocket of unfilled orders left behind when price moves too quickly; these gaps often act as magnets, drawing the price back for a retest before the move continues.
Professional execution in 2026 relies on "Kill Zones"—specific times of the day where Gold volatility is highest and institutional involvement is most concentrated.
- London Open: 12 AM – 6 AM EST; high volatility often creates the daily low or high.
- New York Open: 9:30 AM – 12 PM EST; the most liquid window for XAUUSD as both US and European markets overlap.
- FOMC/CPI Releases: High-impact news events that serve as catalysts for liquidity sweeps and trend reversals.
By combining market structure (H4/Daily) for bias, S/D zones for location, and candlestick patterns (M5/M15) for timing, the price action trader builds a "confluence of evidence" that significantly increases the probability of a successful outcome. This systematic approach is the hallmark of the senior trader, moving away from "guessing" and toward high-precision execution aligned with the actual mechanics of the market.
| Institutional Footprint | Description | Trading Application |
|---|---|---|
| Displacement | Powerful impulse moves with large candle bodies. | Signals institutional entry; look for the FVG left behind. |
| Liquidity Sweep | Price briefly breaks an obvious level before reversing. | Professional setup; "fading" the retail stop-loss run. |
| Fair Value Gap (FVG) | Inefficiency in price where orders were skipped. | Acts as a high-probability entry zone or a target for price. |
| Session High/Low | PDH (Previous Day High) or PDL. | Primary liquidity pools where institutional orders are clustered. |
FAQ: Mastering Price Action Trading Strategy
What are the core principles of price action?
The core principles center on reading the "naked chart"—analyzing raw price movement (candlesticks, swing highs, and swing lows) without the clutter of lagging indicators. It is a methodology based on the belief that all relevant market information, psychology, and institutional intent are already reflected in the price action itself. The goal is to gain a real-time, unfiltered understanding of the battle between buyers and sellers to identify high-probability trading opportunities.
How to identify support and resistance?
Support and resistance are identified by marking visible peaks (peaks) and troughs (valleys) on the chart where the market has previously reversed direction. Professional traders treat these as "zones" rather than exact points and often look for psychological round numbers (like $5,000 for Gold) or historical high-timeframe levels (Daily/Weekly) to find the most significant areas of institutional demand or supply. Trendlines and moving averages can also act as "dynamic" support and resistance levels as they move with price and time.
What are the best online platforms for learning price action?
Top-tier platforms for mastering price action in 2026 include Bear Bull Traders, which focuses heavily on trading psychology and technical training, and Warrior Trading, known for its tiered coursework and live trading experiences. Humbled Trader Academy offers a comprehensive resource for both day and swing traders, while Investors Underground is a leader in community-based learning. For fundamental market foundations, Yale University (via Coursera) provides institutional-grade education on financial markets.
Top price action trading software?
The premier software for price action analysis in 2026 is TradingView, widely recognized for its superior charting capabilities, visual analysis tools, and Pine Script customization. MetaTrader 5 (MT5) remains the most popular platform for forex and CFD automation and multi-asset trading. NinjaTrader is the top choice for professional futures traders, offering specialized order flow and footprint analysis tools. Additionally, Interactive Brokers’ Trader Workstation (TWS) provides institutional-grade tools for advanced risk management and execution.
Where to find price action trading courses?
For structured learning,(https://investortipster.com/courses/courses/) offer a comprehensive roadmap from basic Gold trading to elite graduation-level programs. Other reputable sources include Nial Fuller’s Price Action Trading Mastery Course, which has been a staple in the industry for over a decade , and various technical analysis specializations offered through Udemy and Coursera by certified financial experts. Beginners may also benefit from the structured modules found on Zerodha Varsity or the text-based foundations on Babypips.com.
Conclusion: Achieving an Institutional Edge
As we have explored throughout this guide, mastering price action in the 2026 Gold market is not merely about recognizing shapes on a chart; it is about developing a profound understanding of market mechanics and institutional behavior. In an environment defined by rapid volatility and shifting global paradigms, the trader who can read the unfiltered story of the "naked chart" possesses a significant edge over those who rely on lagging indicators or social media hype. By focusing on market structure, precise support and resistance zones, and the nuanced language of candlesticks, you align yourself with the "Smart Money" that drives the global markets.
However, knowledge is only one half of the equation; execution is the other. To truly succeed, you must equip yourself with the tools and resources designed for the professional trader. Join the Investor Tipster community to gain that institutional edge. Whether you require precise(https://investortipster.com/signals/) to guide your entries, an(https://investortipster.com/marketplace/product/ai-trading/) to manage your Gold exposure with 83%+ accuracy, or high-speed(https://investortipster.com/vps/) hosting to ensure 24/7 reliability for your Expert Advisors, we provide the complete ecosystem for your trading success. Take the next step in your professional journey and experience the power of institutional-grade trading today.