How to Use Market Structure in Gold Trading: A Complete Guide
Gold moves in waves – higher highs, lower lows, and sometimes sudden reversals that catch retail traders off guard. The key to staying on the right side of XAUUSD lies in one foundational concept: market structure. Understanding structure helps you see where price is likely to go next, where institutions are placing orders, and when a trend is truly ending. In this guide, you will learn exactly how to use market structure in Gold trading – with a real example using current XAUUSD levels. And if you'd rather let a machine do the technical work, our AI Trading Bot scans structure 24/7 to deliver automated entries.
What Is Market Structure?
Market structure is the sequential formation of price swings that reveal the underlying trend and potential reversals. Every market moves in a series of higher highs (HH) and higher lows (HL) for an uptrend, or lower highs (LH) and lower lows (LL) for a downtrend. When these patterns break, it signals a shift in sentiment. For Gold, which is highly sensitive to macroeconomic news and liquidity flows, mastering structure is essential because it helps you ignore short-term noise and focus on the real direction.
The core components are:
- Swing High – A peak where price reverses downward for at least two candles.
- Swing Low – A trough where price reverses upward for at least two candles.
- Trend Line – A line connecting swing highs or lows to define the trend channel.
- Break of Structure (BOS) – When price breaks a previous swing high (uptrend) or swing low (downtrend), confirming continuation or reversal.
- Change in Character (CHOCH) – A clear reversal signal where price breaks the last swing point in the opposite direction.
Why Market Structure Matters for Gold Traders
Gold (XAUUSD) is a unique instrument because it often reacts violently to news events like Fed speeches or NFP releases. Without structure, traders get caught buying tops and selling bottoms. Here is why structure is your edge:
- Institutional order flow: Banks and hedge funds build positions at structural levels. When price breaks a swing high, it often means institutions are absorbing liquidity and pushing price higher.
- Clean entry zones: Instead of guessing, you enter at confirmed structure breaks or retests of key levels.
- Objective stop placement: Place stops just beyond the last swing low (for longs) or last swing high (for shorts) for high-probability risk management.
- Timeframe fusion: Structure on higher timeframes (4H, daily) sets the trend; lower timeframe structure (15min, 1H) gives precise entries.
For a practical way to automate this analysis, consider the Price Action Pro EA, which identifies structure breaks and executes trades with predefined risk parameters.
How to Use Market Structure Step by Step (MT4/MT5)
Follow these steps to apply structure analysis to XAUUSD charts today. I’ll use the current session price of $4,725.59 as a live example.
- Open a Daily Chart – Switch to the daily timeframe. Identify the most recent clear swing high and swing low. As of April 24, 2026, the daily chart shows a swing high near $4,760 and a swing low near $4,700. The trend is bearish because price is making lower highs and lower lows.
- Draw Horizontal Levels – Mark the swing high at $4,760 and the swing low at $4,700. These are your key structural points. Price is currently at $4,725.59, sitting between them.
- Identify the Trend – Connect the recent swing highs with a descending trend line. Connect the swing lows with a parallel line. You now have a descending channel. As long as price stays below the descending trend line (around $4,740), the structure remains bearish.
- Look for BOS or CHOCH – A break of the $4,760 level (previous swing high) would be a BOS to the upside and invalidate the bearish structure. A break below $4,700 (current swing low) would be a continuation BOS to the downside, targeting the next support around $4,660.
- Enter on Retest – Once a BOS occurs, wait for a retest of the broken level before entering. For example, if $4,700 breaks, price may retest it as new resistance before dropping further.
- Set Stop and Targets – Place your stop loss just beyond the previous swing point (e.g., $4,720 if shorting after $4,700 break). Take profit at the next structural level (e.g., $4,660). Use a 1:2 risk-reward ratio.
This method works on any timeframe. For automated execution, our Telegram signal copier can mirror structure-based signals straight to your MT4 account.
Common Mistakes Gold Traders Make with Structure
Even traders who understand market structure often fall into these traps:
- Ignoring higher timeframe structure. You might see a break of structure on 15min, but if the daily chart is strongly trending against you, that BOS is likely a false breakout. Always start with the daily or 4H timeframe.
- Chasing price after a BOS. When structure breaks, many traders enter immediately without waiting for a retest. This leads to poor entries and wide stops. Patience pays.
- Not accounting for liquidity. Price often sweeps above a swing high or below a swing low before reversing. That liquidity grab is institutional activity. Use structure to anticipate these sweeps.
- Overcomplicating with too many lines. Stick to the last two or three swing points. Adding old levels from weeks ago adds noise, not clarity.
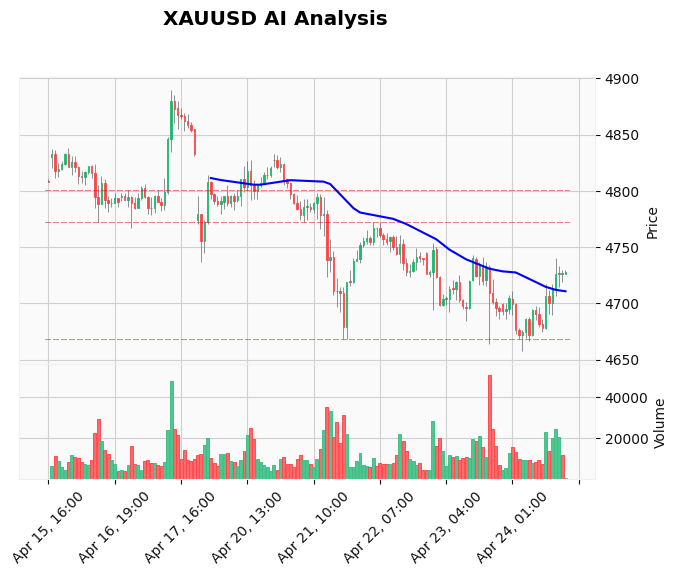
Real Example on XAUUSD Chart (April 24, 2026)
Let’s apply what we just learned to the current market. At 07:30 UTC today, XAUUSD trades at $4,725.59. The most recent structural levels are:
- Resistance/Swing High: $4,760.0 (from earlier this week)
- Support/Swing Low: $4,700.0 (today’s low so far)
- Descending trend line: Drawn from the $4,760 peak to subsequent lower highs around $4,745, currently sloping near $4,735.
The current price is below the trend line, confirming a bearish short-term structure. Immediate resistance is the trend line at $4,735, then the $4,760 swing high. Support is the $4,700 swing low. A break below $4,700 would confirm a continuation of the downtrend and likely target the next major support at $4,660. A break above $4,760 would turn the structure bullish, targeting $4,800.
If you are a short-term trader, you could look for price to retest the $4,735 trend line and reject, then enter short with a stop above $4,740 and target $4,700. For a more conservative approach, wait for a break below $4,700, then short with a stop above $4,715 and take profit at $4,660.
For traders who prefer automated analysis, live Gold trading signals provide real-time structure-based calls with precise entry, stop, and target levels.
Frequently Asked Questions
What is market structure in forex trading?
Market structure is the natural pattern of swing highs and swing lows that reveals the trend direction and potential reversals. In Gold trading, it helps you identify where institutions are likely placing orders and when a trend is likely to continue or reverse.
How do I identify a break of structure in XAUUSD?
A break of structure (BOS) occurs when price moves beyond a previous swing high in an uptrend or below a previous swing low in a downtrend. For Gold, use the daily chart to mark the most recent swing points. A BOS with strong momentum and volume often leads to sustained moves.
Can market structure work on lower timeframes for Gold?
Yes, but you must always align it with higher timeframe structure. For day trading, start with the 4H or 1H chart to determine the general direction, then drop to 15min or 5min for precise entries. Avoid using structure on very short timeframes like 1min without context.
How do I combine market structure with indicators like RSI?
Market structure is best used as the primary tool, with indicators for confirmation. For example, if price breaks a swing high (BOS) and the RSI on the daily chart is above 50 but not overbought, it strengthens the bullish case. Use RSI divergence with structure breaks for high-probability reversal signals.
What is the difference between BOS and CHOCH?
A break of structure (BOS) occurs within the same trend – it confirms continuation. A change in character (CHOCH) is a break of the last swing point in the opposite direction, signaling a potential trend reversal. For Gold, a CHOCH after a long uptrend warns of a major sell-off.
Conclusion
Market structure is the single most reliable way to read price action in Gold. By identifying swing highs, swing lows, and their breaks, you can trade with the flow of institutional money rather than against it. Start by practicing on the daily chart, draw clean lines, and always let price come to your levels before entering. The example from today's $4,725.59 price shows exactly how structure guides your bias and trade plan. To make your trading even easier, our AI Trading Bot never misses a structure break and executes trades automatically – learn more and start your free trial today.
Risk Disclaimer: Trading Gold (XAU/USD) involves significant risk of loss. This content is for informational purposes only and does not constitute financial advice. Always conduct your own research and trade responsibly.