Fibonacci Retracement Explained: A Gold Trader's Complete Guide
Every Gold trader has faced the moment when price reverses right at a seemingly random level and you wonder: why there? The answer often lies in Fibonacci retracement. This ancient mathematical sequence, applied to modern XAUUSD charts, gives you precise levels where institutions place orders, stops cluster, and trend reversals happen. By understanding how to use Fibonacci in Gold trading, you can anticipate these turning points instead of chasing price. Let's turn this tool into a practical edge.
Want to trade these levels automatically? Our AI Trading Bot scans XAUUSD around the clock, executing Fibonacci-based setups with an 83%+ win rate.
What Is Fibonacci Retracement?
Fibonacci retracement is a technical indicator that identifies potential support and resistance levels by measuring how far price retraces against the prior move. The key ratios – 23.6%, 38.2%, 50%, 61.8%, and 78.6% – are derived from the Fibonacci sequence (0, 1, 1, 2, 3, 5, 8, 13…). In trading, the 61.8% (the golden ratio) is the most respected, often acting as a strong reversal zone. The 50% level, though not a true Fibonacci number, is widely watched as a psychological midpoint. These levels work because thousands of traders and algorithms watch the same numbers, creating self-fulfilling zones of buying and selling pressure.
Why It Matters for Gold Traders
Gold trends are notoriously persistent yet punctuated by sharp pullbacks. Fibonacci retracement helps you distinguish a healthy correction from a trend change. For example, after a strong rally from $4,200 to $4,600, a 38.2% retracement lands near $4,447 – remarkably close to the current sell-stop level at $4,480. That tells you the market expects a deeper pullback toward the 38.2% zone before sellers step in. Gold also respects Fibonacci extensions for profit targets, making it invaluable for both entries and exits. Unlike oscillators that lag, Fibonacci gives you forward-looking levels that remain relevant across all timeframes.
How to Use Fibonacci Step by Step on XAUUSD
Step 1: Identify a clear swing move. Open an MT4 or TradingView chart. For Gold, use the 1H or 4H timeframe. Find a distinct low and high – the larger the move, the more reliable the retracement levels. For instance, if Gold fell from $4,600 to $4,300, that is a valid swing.
Step 2: Draw the Fibonacci tool. Click the Fibonacci retracement tool in your platform. Drag from the swing low to the swing high (for an uptrend retracement) or from swing high to swing low (for a downtrend retracement). The lines will automatically appear at the key ratios.
Step 3: Mark the key levels. Focus on 38.2%, 50%, and 61.8%. These are where price often reacts. In a downtrend, these become resistance; in an uptrend, support.
Step 4: Wait for a price reaction. Do not enter blindly when price touches a level. Look for a confirmation – a candlestick rejection, an RSI divergence, or a volume spike. For example, if Gold approaches the 61.8% retracement at $4,430 and forms a bullish engulfing candle, that is a low-risk long entry.
Step 5: Set stop loss and take profit. Place your stop beyond the next Fibonacci level or the swing extreme. For a long from the 61.8% level, a stop could be 5 pips below the 78.6% retracement. Take profit at the previous swing high or use Fibonacci extensions (161.8% for rallies).
For an automated approach, the Price Action Pro EA integrates Fibonacci levels with market structure, executing entries and exits without manual chart work.
Common Mistakes Gold Traders Make with Fibonacci
Mistake 1: Using it on noisy scalping timeframes. Fibonacci works best on 15-minute charts and above. Ticking charts produce unreliable levels that chop you out.
Mistake 2: Ignoring context. An 61.8% level is less significant during major news events or when price is near a strong horizontal support/resistance. Always combine Fibonacci with trend direction and fundamentals.
Mistake 3: Drawing incorrectly. Many traders start the swing at the wrong point. The swing must capture the entire move – the pullback should be less than 100% of the prior move. Double-check your anchor points.
Mistake 4: Taking every bounce or rejection as a signal. Price often “kisses” a level and continues, especially in powerful trends. Wait for a confirmed reversal candlestick or a second touch.
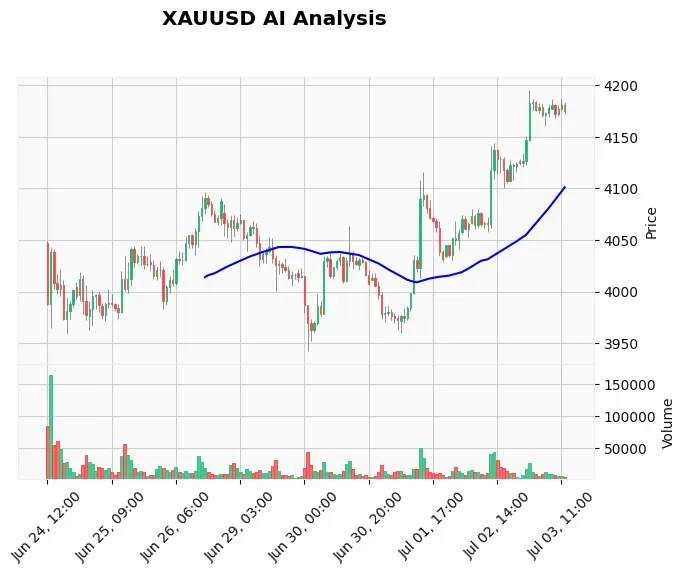
Real Example: Fibonacci on the Current XAUUSD Chart
Let us apply this to today’s Gold market. The latest signal on investortipster.com shows a sell-stop at $4,480. Assume the prior swing was from $4,200 (low) to $4,600 (high) – a rally of $400. Drawing Fibonacci from low to high gives:
- 23.6% retracement at $4,505
- 38.2% retracement at $4,447
- 50% retracement at $4,400
- 61.8% retracement at $4,352
For live trade ideas, check our professional XAU/USD signals updated daily with Fibonacci-based entries.
FAQ
Q: What Fibonacci level is most important for Gold?
A: The 61.8% retracement is the strongest, often acting as a major support or resistance zone in Gold. Many large players and hedge funds place orders here.
Q: Can I use Fibonacci in a strong trend?
A: Absolutely. In an uptrend, buy at the 38.2%-61.8% retracement zone. In a downtrend, sell into these levels. Fibonacci works especially well in trending markets.
Q: What timeframe is best for Fibonacci on XAUUSD?
A: For day trading, use the 1H and 4H charts. For swing trading, daily and weekly charts provide the most reliable levels.
Q: Do I need to draw Fibonacci manually, or can I automate it?
A: Manual drawing teaches you the psychology, but automated tools are convenient. Our Gold trading EAs automatically detect Fibonacci levels and place trades accordingly.
Q: How do I set stop loss using Fibonacci?
A: Place your stop just beyond the next Fibonacci level. For a long at the 61.8% level, set stop below the 78.6% retracement. This gives the trade room to breathe while protecting capital.
Conclusion
Fibonacci retracement is not a crystal ball – it is a probability framework. When combined with price action, trend analysis, and sound risk management, it transforms random price moves into structured zones you can trade with confidence. Start by marking the current levels around $4,480 and see how price reacts. Practice on a demo account, then integrate Fibonacci into your Gold strategy.
Ready to automate these techniques? Try our AI-powered XAU/USD bot – it trades Fibonacci setups 24/7 while you sleep.
Trading Gold (XAU/USD) involves significant risk of loss. This content is for informational purposes only and does not constitute financial advice. Always conduct your own research and trade responsibly.