Gold Price Today April 08 2026 Europe: $4,813 Pivot Ahead of FOMC Storm
The Gold price today April 08 2026 Europe finds itself in a classic pre-event consolidation, hovering around $4,813. European traders are navigating a calm before a potential storm, with the Federal Reserve's Meeting Minutes just 10 hours away. Price action has retreated slightly from the Asian session high of $4,821, respecting this key technical resistance. The broader narrative remains bullish, fueled by a tumbling US Dollar and geopolitical de-escalation, but the immediate technical picture warns of a short-term pullback risk as the RSI flirts with overbought territory. This is not a market to force trades in; it's a market to prepare for. Want to navigate this high-stakes volatility with precision? Our AI Trading Bot is engineered to process event-driven chaos, executing high-probability Gold trades 24/7 with an 83%+ win rate.
Gold Market Overview: Bullish Sentiment Meets Event Risk
The European session opens with a clear bullish macro bias but palpable caution. Gold's firm stance near three-week highs is primarily a story of USD weakness. The US Dollar Index (DXY) has slumped, with markets continuing to rejoice over the announced two-week ceasefire between the US and Iran. This easing of immediate geopolitical risk premium has paradoxically boosted risk assets and pressured the Dollar, indirectly supporting Gold. The market intelligence is unanimous: "Oil down, gold up. USD down, equities up." This environment suggests capital is rotating out of safe-haven Dollars and into other assets, including Gold. However, the celebratory mood is tempered by the looming shadow of the Fed. The bullish narrative of a less hawkish central bank is already priced in to a large degree, setting the stage for a classic "sell the fact" reaction if the FOMC Minutes strike a more cautious or neutral tone than expected. For now, the path of least resistance is higher, but it's a path mined with event risk.
Technical Analysis: Consolidation at a Decision Point
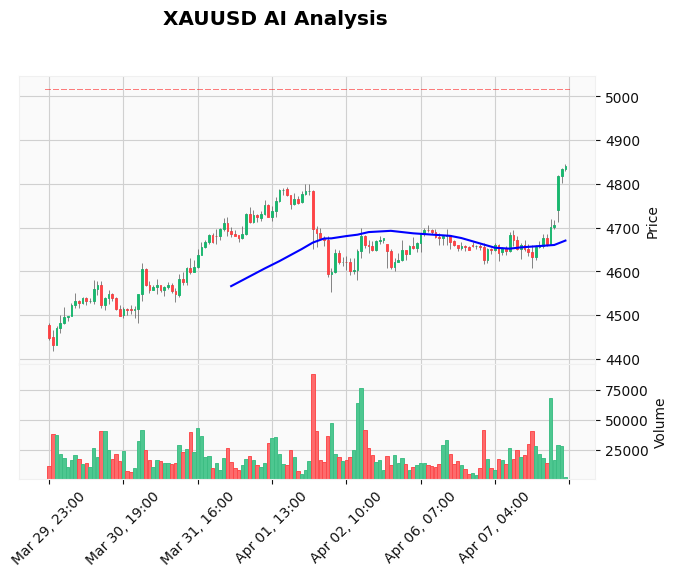
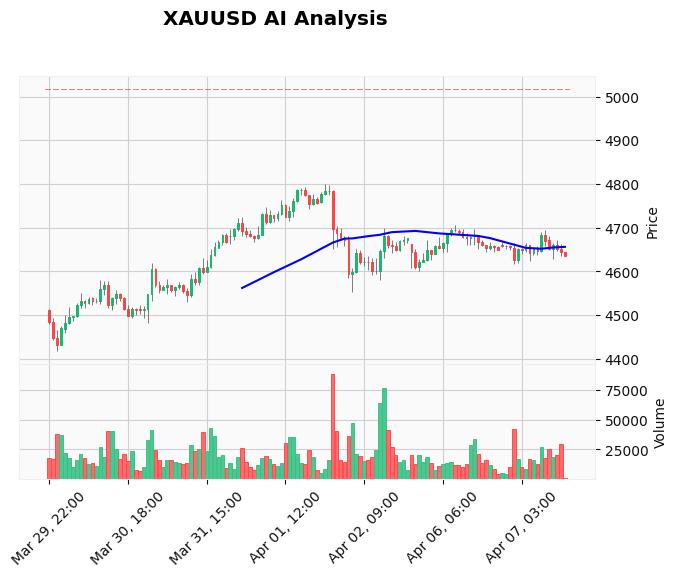
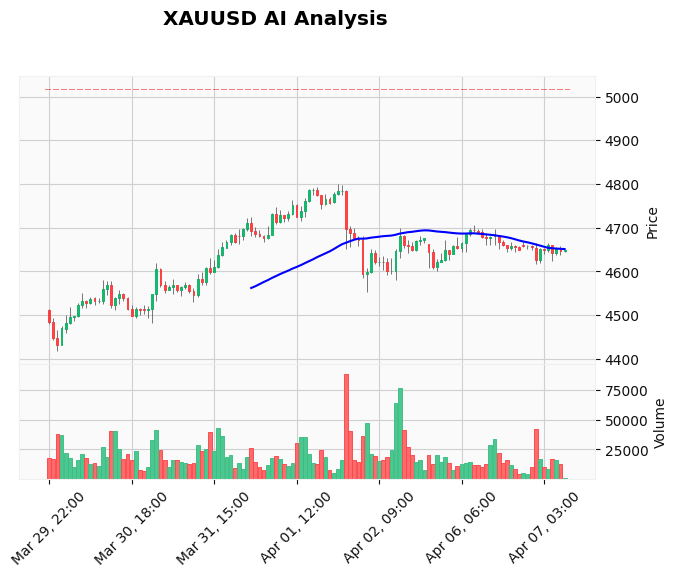
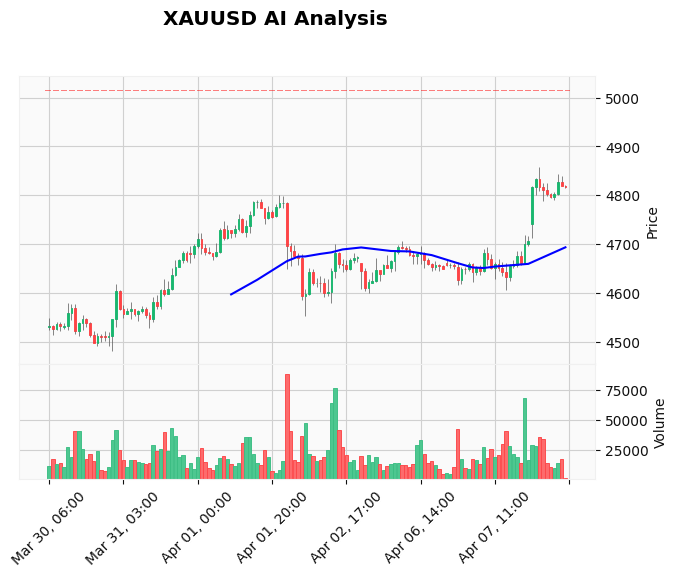
The technical structure confirms the bullish trend but highlights the immediate exhaustion. On the daily chart, price sits comfortably above all key Exponential Moving Averages—the 20-day EMA at $4,760, the 50-day at $4,712, and the long-term 200-day at $4,654. This stacked bullish EMA alignment is the foundation of the uptrend. However, the shorter-term charts, particularly the M15, show a distinct loss of bullish momentum following the Asian push to $4,821.
Key levels are crystal clear. Resistance is firmly established between $4,820 and $4,830, representing the recent swing highs. A decisive break above $4,830 opens the path towards the $4,900 psychological level. The Support structure is layered: the first critical floor is at $4,780 (a previous swing high), followed by a much stronger zone around $4,750-$4,759, which aligns with the 20-day EMA. The webhook data confirms immediate resistance at $4,800 (R2) and support at $4,706 (R1, now acting as support).
Momentum indicators are in warning territory. The 14-period RSI reads 67.45, approaching the overbought threshold of 70. While not a sell signal in a strong trend, it indicates limited buying power for the immediate push higher. The MACD remains positive at 42.51 above its signal line (35.87), confirming the bullish momentum on the higher timeframe, but the histogram may be nearing a peak. The Average True Range (ATR) of 31.58 pips warns traders to expect significant volatility, which will likely expand around the FOMC release.
Fundamental Drivers: The FOMC Minutes as the Main Event
All fundamental roads lead to the Federal Reserve today. The US-Iran ceasefire provided the initial fuel for the rally, removing an immediate source of panic buying and allowing a broader "risk-on" Dollar sell-off to benefit Gold. However, this is now in the rearview mirror. The primary driver for the next 24 hours is US monetary policy.
The FOMC Meeting Minutes (in 10 hours) will be scrutinized for any nuance on the timing and pace of future rate cuts. Markets are currently priced for a dovish Fed. Any hint of hesitation, concern over persistent inflation, or a need for "higher for longer" rates could trigger a sharp USD rebound and a corresponding Gold sell-off. Conversely, confirmation of a data-dependent path toward easing could see Gold challenge the $4,830 resistance. Following the Minutes, the market's focus will shift to the Core PCE Price Index and Final GDP data due tomorrow. Trading this news cycle manually is fraught with slippage and emotion. A disciplined approach is key, which is why many professional traders use an automated News Trading Bot to capture these volatile moves with pre-defined logic and lightning speed.
Devil's Advocate: Why a Pullback to $4,750 is Likely
Despite the overwhelmingly bullish setup, a compelling contrarian case exists. The market has rallied significantly on expectations of a dovish Fed. This creates asymmetric risk: the potential downside from a neutral/hawkish surprise outweighs the upside from a confirmed dovish one. Technically, the RSI near 67.45 shows bulls are tired. A rejection at the $4,820-$4,830 resistance zone could trigger a healthy pullback to recharge momentum. The most logical target for such a move is the strong confluence support between $4,750 (previous structure) and the rising 20-day EMA at $4,759. This would be a 50-70 pip decline—a normal and healthy correction within a bull trend. A break below $4,780 would be the first warning sign that this pullback scenario is playing out. The bullish trend would only be invalidated with a daily close below the 50-day EMA at $4,712.
Trading Strategy for the European Session
Given the high-impact event risk just hours away, the optimal strategy for the European session is patience and preparation. Forcing a trade in this compressed, pre-event range is low probability.
Bias: Bullish overall, but expecting pre-FOMC consolidation/pullback.
Scenario 1 (Preferred - Wait for Pullback): Wait for a dip into the $4,758-$4,770 support zone (20-day EMA confluence). A bullish reversal pattern (e.g., pin bar, bullish engulfing) on a 1-hour or 4-hour chart here could offer a high-risk-reward long entry ahead of the Minutes. Initial Stop Loss: Below $4,750. Take Profit Targets: TP1 at $4,800, TP2 at $4,820.
Scenario 2 (Breakout): A sustained break and close above $4,830 could signal momentum resumption. A retest of this breakout level could offer a long entry. Stop Loss below $4,815.
The key is to have clear levels defined and to wait for price to come to you. For traders who struggle with this discipline, a systematic tool like our Price Action Pro EA can scan for these precise setups across multiple timeframes, removing emotion from the equation.
Risk Management: Respect the Event Volatility
Today is a day to reduce position size significantly if trading manually. The ATR of 31+ pips can easily double around the FOMC release, meaning stops placed too tight will be hunted. Always ensure your risk per trade does not exceed 1-2% of your capital. If opting for the pullback long setup, the risk from $4,770 to $4,750 is 20 pips. Size your position so that a 20-pip loss is acceptable. For breakout trades, be aware of false breaks, especially in thin pre-event liquidity. The safest approach may be to observe the initial reaction to the Minutes and trade the subsequent re-direction move after the first spike of volatility subsides.
Frequently Asked Questions (FAQ)
Q: What is the key Gold price level to watch today?
A: The most critical level is resistance at $4,820-$4,830. A break above signals a continuation towards $4,900. The key support zone is $4,758-$4,780. A break below $4,780 suggests a deeper pullback is underway.
Q: How will the FOMC Minutes affect Gold price?
A: Dovish minutes (emphasizing future cuts) could weaken the USD and push Gold higher, potentially breaking $4,830. Hawkish or neutral minutes (highlighting inflation concerns) could strengthen the USD, triggering a profit-taking sell-off in Gold towards $4,750 support.
Q: Is Gold overbought right now?
A: The daily RSI at 67.45 is elevated but not definitively overbought (above 70). It suggests limited short-term upside momentum and increases the probability of a consolidation or pullback before the next leg higher, especially with major news pending.
Q: What is a good Gold trading strategy before high-impact news?
A: The best strategy is often to reduce position size, widen stops, or stay flat until after the news release. The goal is to preserve capital and avoid the initial chaotic volatility, then trade the established direction once the market digests the information.
Conclusion
The European session sets the stage for a pivotal moment in Gold markets. Price action around $4,813 reflects a market in balance, torn between a bullish macro backdrop and the immediate overbought technicals ahead of a high-impact event. The FOMC Minutes will act as the catalyst that breaks this equilibrium. Traders should focus on the two technical boundaries: a break above $4,830 for a bullish continuation, or a rejection leading to a pullback towards the $4,758-$4,780 value area. Success today hinges less on predicting the news and more on disciplined reaction to the price action that follows it. Capital preservation is paramount. For those seeking a consistent, rules-based approach to capture moves in these exact conditions, exploring an AI Trading Bot can provide a significant edge, turning high-volatility events from risks into quantified opportunities.
Risk Disclaimer: Trading Gold (XAU/USD) involves significant risk of loss. This content is for informational purposes only and does not constitute financial advice. Always conduct your own research and trade responsibly. Past performance of any trading system or methodology is not indicative of future results.