Gold Price Forecast: Week of May 16-22, 2026 – Bears Test Key Support at $4400
Gold suffered its worst weekly decline in two months, shedding 3.27% to close at $4538.28. The precious metal broke below the $4600 psychological zone and is now threatening the $4400 handle. As we enter the week of May 16, traders are asking: Is this the start of a deeper correction, or an oversold bounce waiting to happen? In this comprehensive weekly forecast, we analyze the technical setup, fundamental drivers, and key levels every XAUUSD trader needs to watch. If you want to trade these moves automatically, our AI Trading Bot executes high-probability setups on Gold 24/7.
Last Week in Review
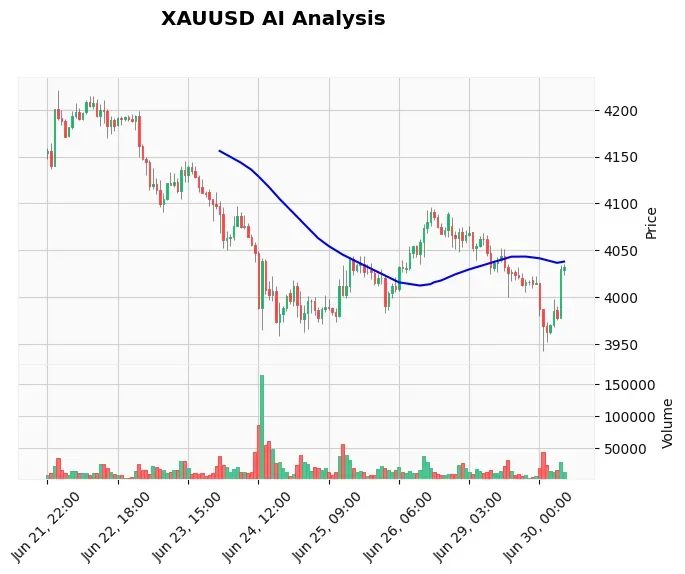
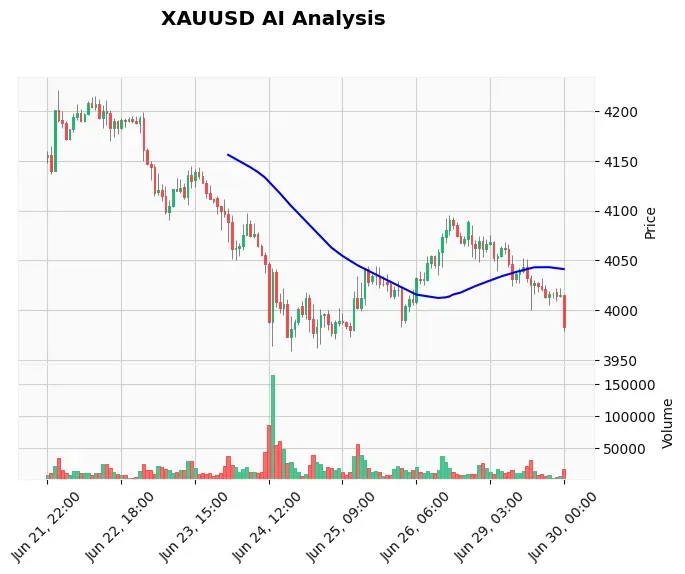
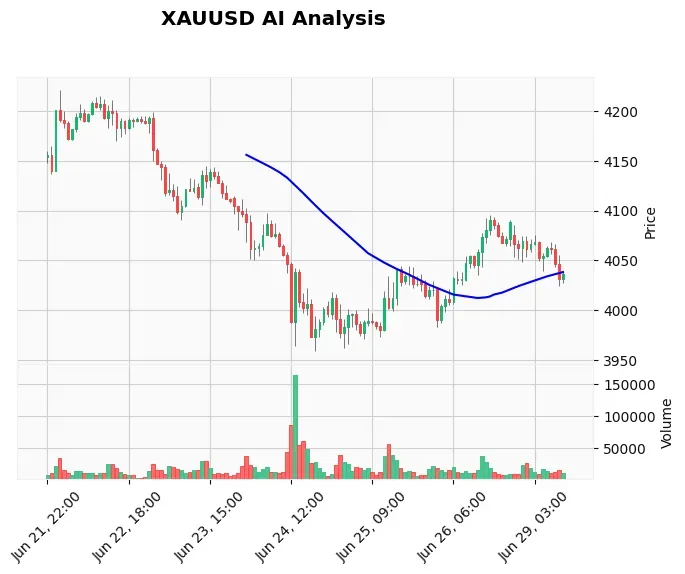
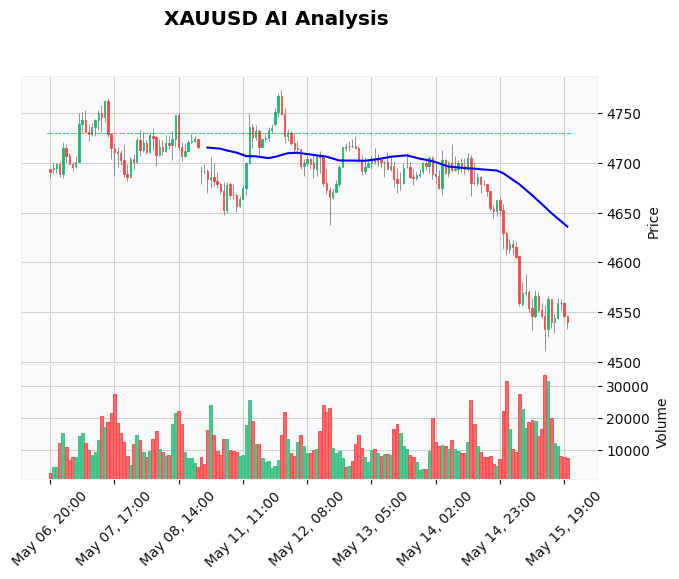
Gold opened the week at $4691.67 and rallied to a high of $4773.53 on Monday as geopolitical jitters from the Iran conflict briefly boosted safe-haven demand. However, the rally was short-lived. A surge in US Treasury yields – driven by oil-induced inflation fears – combined with a strengthening US Dollar turned the tide. By Tuesday, gold began a relentless slide, breaking below $4700, then $4600, and finally testing a low of $4511.86 on Friday. The weekly close at $4538.28 was near the lows, confirming bearish control. Silver crashed 7.9% during the same period, further confirming broad metal weakness. The MACD turned negative (-25.73), and the RSI dropped to 39.27 – not yet oversold but approaching.
Weekly Technical Outlook
The weekly chart shows price trading below both the 20 EMA ($4667) and 50 EMA ($4714), forming a bearish moving average crossover. The 200 EMA sits far below at $4362, providing a long-term floor. The RSI reading of 39.27 indicates bearish momentum but leaves room for further downside before reaching oversold territory (below 30). The MACD line (-25.73) is below the signal line (-26.15) but the gap is narrow – a potential sign of slowing momentum. The Average True Range (ATR) is elevated at $111.80, reflecting high volatility.
Key Levels:
- Resistance 1: $4889 (R1) – unexplored this week.
- Resistance 2: $5419 (R2) – distant target.
- Support 1: $4099 (S1) – major long-term support from 2024.
- Support 2: $4402 (S2) – recent demand zone from March 2026.
With price closing just above S2, this level becomes the immediate battleground. A breakdown below $4402 opens the door to $4300 and then the 200-week EMA near $4099.
Three Scenarios for the Week
Bullish Scenario: Gold bounces from the $4400-$4420 area, reclaims $4550, and tests the 20 EMA at $4667. This would require a catalyst (e.g., a dovish Fed comment or a ceasefire in the Iran conflict). If price closes above $4600, the bearish thesis weakens.
Bearish Scenario: Continued USD strength and rising yields push gold below $4402. A weekly close below this level would target $4300 and then $4200. The bearish momentum could accelerate if silver breaks below $25.
Neutral Scenario: Range-bound between $4400 and $4600 for most of the week. Low volatility due to a quiet economic calendar. Traders may fade the extremes.
For a deeper analysis, our live Gold trading signals provide real-time entries and exits.
Fundamental Outlook
The macro environment remains a headwind for gold. The Iran conflict continues to keep oil prices elevated, stoking inflation fears and forcing the Fed to maintain a hawkish stance. Markets are repricing rate cuts – the first full cut is now not expected until September 2026, which supports the USD. The DXY ended the week around 99.80, near its 2026 highs. Meanwhile, Asian stories from Singapore and Taiwan show robust tech exports, but that does little for gold demand. The only positive for gold could be a sudden de-escalation in the Middle East or a surprise weak US data point. However, with no high-impact US economic releases next week (no FOMC, NFP, CPI), the focus will shift to PMI data from Europe and the US, and central bank commentary from ECB and BoE. Any dovish surprise could spark a short-covering rally.
Market participants should monitor the US 10-year yield closely – above 4.2% will keep gold under pressure. Conversely, a drop below 4.0% would be bullish for gold.
Economic Calendar (USD High-Impact Events)
| Date | Event | Previous | Forecast |
|---|---|---|---|
| May 19 | No high-impact events | - | - |
| May 20 | No high-impact events | - | - |
| May 21 | No high-impact events | - | - |
| May 22 | No high-impact events | - | - |
With a quiet calendar, gold will be driven by technicals, headlines from the Iran conflict, and general risk sentiment. This increases the likelihood of technical trading and range-bound action.
Gold Trading Strategy This Week
Based on our AI model, we maintain a bearish bias. The active signal from Friday is a SELL_STOP at 4520.0, with stop-loss above prior support at 4560.0 and take-profit at 4480.0. This setup targets a continuation below the recent low of $4511.86. For swing traders, a more aggressive entry on a retest of $4550-4560 with a stop above $4600 and target $4400 is also valid. If price breaks below $4402, add to shorts targeting $4300.
Day Trade Setup: Sell rallies into $4550-4560 during the Asian/European sessions. Avoid buying unless price reclaims $4600 with volume. Use the ATR ($111) to set profit targets – a move of 0.5 ATR (~$55) from entry is reasonable.
For traders who prefer automated execution, our Price Action Pro EA can manage these entries and exits with precision.
Risks to Watch
The primary risk to the bearish view is an unexpected geopolitical ceasefire that triggers a risk-on rally and USD weakening. Additionally, the RSI is approaching oversold territory – a snap-back rally could liquidate short positions. Invalidation level: a daily close above $4600 would turn us neutral. A close above $4667 (20 EMA) would imply a trend reversal. On the downside, a weekly close below $4400 confirms the bear scenario.
Historical Context
Gold has experienced similar sharp selloffs during risk-off episodes, such as August 2024 when it dropped 8% in two weeks from $2500 to $2300 after strong US jobs data. In that case, gold found support at the 200-week EMA and rebounded 15% over the next three months. This time, the 200 EMA is at $4362, providing a similar long-term floor. However, the fundamental backdrop (sticky inflation, Fed reluctance to cut) is more bearish than in 2024. Traders should not assume a swift rebound – patience is key.
Frequently Asked Questions
Q: What is the gold price forecast for this week?
A: Gold is expected to test support near $4400. A breakdown could see $4300, while a bounce may face resistance at $4550 and $4600. The overall bias is bearish.
Q: Why is gold falling?
A: A stronger US Dollar and rising Treasury yields due to oil-induced inflation fears from the Iran conflict are pressuring gold. The market is repricing Fed rate cuts, reducing gold’s appeal.
Q: Should I buy the dip in gold?
A: Currently not advisable until price reclaims $4600. The trend is bearish, and indicators (RSI, MACD) suggest more downside. Wait for a confirmed reversal pattern or a fundamental catalyst.
Q: What is the best way to trade XAUUSD this week?
A: Consider short positions on rallies to $4550-4560 with a stop above $4600. Use a risk-reward of at least 1:2. For automated trading, the AI Trading Bot can execute this strategy 24/7.
Q: Are there any important economic events for gold next week?
A: No high-impact US events are scheduled. However, global PMI data and central bank speeches could create volatility. Stay updated with our News Trading Bot that reacts to headlines in real time.
Q: What is the risk of shorting gold at current levels?
A: The RSI at 39.27 is not yet oversold, but it is low. A sudden news-driven rally could stop out short trades. Use tight stops and consider a VPS for execution stability – our Windows VPS for Gold trading ensures zero downtime.
Conclusion
Gold enters the week on the back foot with a clear bearish bias. Key support at $4402 is the line in the sand – a break below could accelerate losses toward $4300. However, with a quiet economic calendar, we may see a consolidation phase as traders wait for the next catalyst. The most prudent approach is to stay short with defined risk, and avoid catching a falling knife. If you want to automate this entire strategy, our AI Trading Bot has a proven 83% win rate on XAUUSD and will adapt to market conditions around the clock. Trade responsibly.
Risk Disclaimer: Trading Gold (XAU/USD) involves significant risk of loss. This content is for informational purposes only and does not constitute financial advice. Always conduct your own research and trade responsibly.