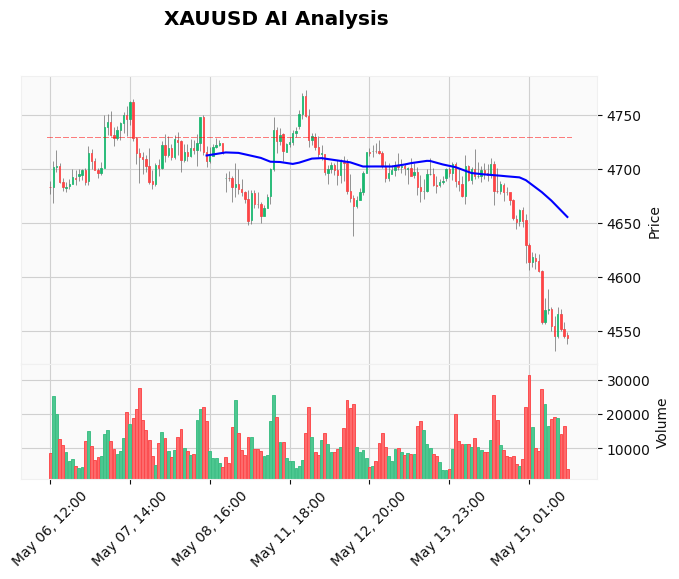
Gold is collapsing in the American session on May 15, sliding to a fresh intraday low near $4,533 as the US Dollar and Treasury yields rip higher. This Gold live analysis May 15 American market breaks down exactly where price is headed next after a brutal 2% sell-off that has erased nearly $100 from the weekly high. If you are trading XAUUSD right now, the only question that matters is whether $4,520 support holds — or breaks.
Want to trade this Gold breakdown automatically? Our AI Trading Bot runs 24/7 on XAUUSD and caught this short move from $4,541. No emotions, no hesitation — just data-driven execution.
Gold Market Overview
The macro picture is overwhelmingly bearish for gold heading into the New York close. The US Dollar Index (DXY) surged to fresh session highs above 104.50 as the 10-year Treasury yield spiked 10 basis points to 4.562% — its highest level in three weeks. The catalyst? A much stronger-than-expected NY Fed Manufacturing Index for May, which printed at 19.6 versus the 7.5 estimate. That beat reignited fears that the Federal Reserve may need to hike rates again, sending bond yields soaring and crushing zero-yield gold.
Equities are also selling off sharply, confirming a risk-off rotation driven by higher rates rather than fear. In this environment, gold loses its safe-haven appeal because the opportunity cost of holding bullion rises with every tick higher in yields. The broader market mood is defensive, and XAUUSD is bearing the brunt of the repricing.
On the geopolitical front, Trump-Xi trade talks continue to generate headlines, but the market is laser-focused on the macro data. Until the Dollar and yields peak, gold remains under pressure.
Technical Analysis
The technical picture is textbook bearish momentum. On the H1 chart, price is trading in a clean descending channel with a sequence of lower highs and lower lows. The breakdown below the $4,555–$4,560 support zone triggered accelerated selling, and the bears are now in full control.
Key technical readings (from TradingView webhook — 60-min timeframe):
- EMA Structure: Price is trading well below the 20 EMA ($4,593), 50 EMA ($4,638), and 200 EMA ($4,667). This is a full bearish alignment — every moving average acts as resistance above.
- RSI: 24.65 — deeply oversold, but during strong trends, the RSI can stay oversold for extended periods without a bounce. This is not a buy signal yet.
- MACD: -35.67 with the signal line at -30.88 — both deeply negative and widening, confirming bearish momentum is accelerating.
- ATR: 23.54 — elevated, reflecting the high volatility of this sell-off. Expect intraday swings of $20+ per hour.
- Support: $4,520 (immediate, the current TP level) and $4,500 (psychological round number).
- Resistance: $4,550 (former support turned resistance) and $4,565 (the high of the current bearish channel).
The descending channel resistance sits near $4,560–$4,565, and as long as price stays below that, the path of least resistance is lower. For a detailed chart-based breakdown, our Price Action Pro EA identifies these structures in real time and executes based on order-block logic.
Fundamental Drivers
The primary driver of today's sell-off is the repricing of US rate expectations. The New York Fed Manufacturing Index blew past estimates, with new orders surging to 22.7 (versus 19.3 last month) and the prices paid component rising sharply. This suggests that inflationary pressures in the manufacturing sector remain sticky, which the market interprets as a green light for the Fed to keep rates higher for longer.
Treasury yields reacted immediately — the 2-year yield jumped 12 basis points, and the 10-year broke above 4.55%. With real yields rising, gold's opportunity cost increases, triggering systematic selling from macro funds and momentum traders.
The US Dollar is also benefiting from this repricing, pushing DXY to multi-week highs. A stronger Dollar is a direct headwind for gold, as the two assets typically move inversely. News headlines from FXStreet confirm the theme: 'Gold tumbles nearly 2% as stronger US Dollar, rising yields weigh on bullion.'
Traders looking to automate their reaction to high-impact news events should check out the News Trading Bot, which scans economic releases in real time and executes around the volatility.
Devil’s Advocate
Every strong trend has a counter-narrative. Here are three reasons the sell-off could stall or reverse:
- Oversold Bounce Risk: The RSI at 24.65 is in deeply oversold territory. A short-covering rally toward $4,550 or even $4,565 is possible if a catalyst triggers a snapback.
- Geopolitical Bid: Trump-Xi talks remain fluid. Any negative headline — a breakdown in negotiations, new tariffs, or military rhetoric — could spark a flight-to-safety bid that lifts gold sharply.
- Central Bank Floor: Global central banks continue to buy gold at a record pace. This structural demand creates a physical floor that institutional traders respect near key support zones like $4,500.
That said, the counter-arguments do not outweigh the momentum. Until price reclaims $4,565 and holds above the descending channel resistance, the bearish bias remains intact. A break above $4,600 would invalidate the short thesis entirely.
Trading Strategy for This Session
The active SELL signal from the AI Analysis Log remains valid: entry at $4,541.65, stop-loss at $4,565.00, and take-profit at $4,520.00. Price is currently trading at $4,533, meaning the trade is slightly in profit. The strategy is simple — hold, and let the bearish momentum carry price toward the target.
Key levels to watch for the remainder of the US session:
- If price breaks below $4,520: Expect acceleration toward $4,500. Trail stops tighter and consider partial profit-taking at $4,520.
- If price bounces from $4,520: Expect a short-covering rally toward $4,550. Re-entry shorts near $4,550 with the same SL at $4,565 would be a valid continuation play.
- If price breaks above $4,565: The short thesis is invalidated. Close the trade and wait for a new setup.
For traders who prefer a hands-off approach, consider using live Gold trading signals from our professional analyst team, delivered directly to your MT4.
Risk Management
With an ATR of $23.54, every position on XAUUSD right now requires wider stops and smaller lot sizes. A standard 1-lot position carries a $2,354 daily range — that is significant drawdown risk if not managed properly. Limit risk to 1–2% of your account per trade, and never increase position size to compensate for a losing trade.
If the TP at $4,520 is hit, take the profit and step aside. Do not chase the move lower without a new confirmed setup. If SL at $4,565 is hit, accept the small loss and wait for the next pattern. Discipline in execution separates consistent traders from gamblers.
Frequently Asked Questions
Q: Is gold going to crash further today?
A: The technical and fundamental setup favors further downside toward $4,520 and potentially $4,500. The US Dollar and Treasury yields are surging, and there is no immediate catalyst to reverse the momentum. However, the RSI is oversold at 24.65, so a short-term bounce is possible before any continuation lower.
Q: What is the next support level for XAUUSD?
A: The immediate support is $4,520, which is the current take-profit target from the active SELL signal. Below that, the psychological $4,500 level is the next major floor. A break below $4,500 would open the door to $4,480 and potentially the $4,450 zone.
Q: Why is gold falling despite geopolitical uncertainty?
A: Gold is currently being driven by macro factors — specifically, rising US Treasury yields and a stronger Dollar. The market is focused on the Fed's next move, and the strong NY Fed Manufacturing data has reignited rate-hike fears. Geopolitical uncertainty provides a floor, but it is not strong enough to overcome the yield-driven selling right now.
Q: Should I buy the dip in gold?
A: Buying a dip in a strong bearish trend is risky. Wait for a confirmed reversal pattern — such as a higher high above $4,565 or a bullish divergence on the RSI — before considering long positions. The path of least resistance is lower until price reclaims key resistance levels.
Conclusion
The American session on May 15 is delivering a textbook Gold sell-off driven by surging US yields, a strengthening Dollar, and a repricing of rate expectations. Price is trading near $4,533 with bearish momentum targeting $4,520 and $4,500. The active SELL signal from the AI system remains valid, and disciplined traders should hold the bias as long as price stays below $4,565 resistance.
If you want to automate this type of analysis and execution, try our best-selling AI-powered Gold trading bot — it captures trends like this 24/7 without you needing to stare at the charts.
Trading Gold (XAU/USD) involves significant risk of loss. This content is for informational purposes only and does not constitute financial advice. Always conduct your own research and trade responsibly.