Gold price forecast May 15 2026 Asia open: Bears Test $4,638 Support
Gold opens the Asian session under heavy selling pressure, extending the decline from Thursday’s US close. XAU/USD is now hovering near the $4,630 handle, testing a critical support zone that could determine the direction for the rest of the week. The Gold price forecast May 15 2026 Asia open remains bearish as technical indicators flash relentless downside momentum. If you want to trade this setup automatically, our AI Trading Bot runs 24/7 on XAU/USD with an 83%+ win rate, capturing moves like these without emotion.
Gold Market Overview
Sentiment across the precious metals complex is heavily tilted to the downside. The US Dollar Index (DXY) continues to climb, supported by hawkish remarks from Federal Reserve officials and the absence of high-impact economic data today. The ongoing Trump-Xi summit in Beijing has created some headlines, but the net effect on haven demand remains muted as the dollar strengthens. Asian equity markets are mixed, offering no clear risk-on or risk-off cue. With the fundamental calendar empty, gold is taking its cue purely from technicals and the dollar’s momentum.
Technical Analysis
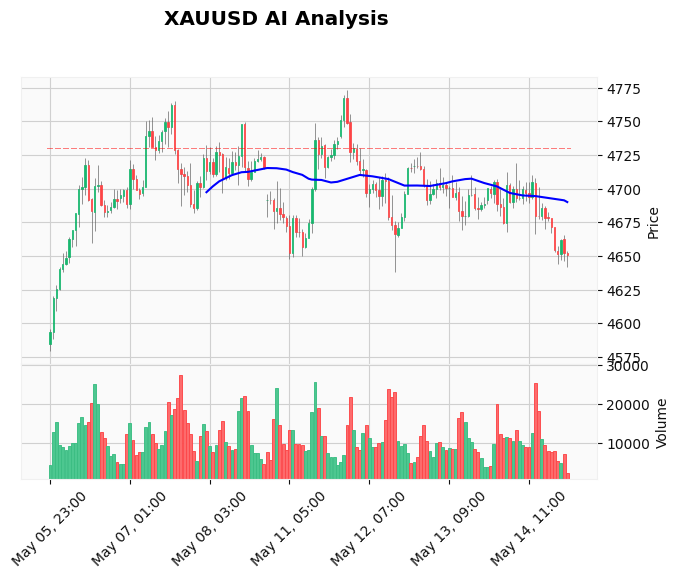
Our TradingView webhook data, received just minutes ago, shows a clear bearish structure on the 60-minute chart. Price closed at $4,629.99, well below all three key moving averages: EMA 20 at $4,672.48, EMA 50 at $4,685.02, and EMA 200 at $4,680.87. This confirms a fully bear-aligned moving average configuration. The 14-period RSI stands at 29.63, entering oversold territory, but the MACD continues to print negative values (-12.25) below its signal line (-7.25), suggesting momentum has not yet exhausted. The ATR of 19.19 indicates elevated volatility, which is typical during sharp breakdowns. Support levels are clustered around $4,638 (first key level) and $4,648, though the lower high/low price action points to the $4,638 area as the more immediate line in the sand. On the upside, resistance is distant at $4,773 and $4,765. A chart of the current setup is available here.
Fundamental Drivers
The primary fundamental headwind remains the strong US Dollar. Fed Governor Barr reiterated yesterday that shrinking the balance sheet via liquidity cuts risks stability, and he has not yet decided on the June FOMC rate decision. Fed’s Williams added that policy is in a good place and sees no case for a rate move, which the market interpreted as a signal that rates will stay higher for longer. Combined with the Trump-Xi summit that has not produced any surprise easing of trade tensions, gold lacks a catalyst to reverse. Today, there are no high-impact USD events on the calendar, so the dollar’s intraday rhythm and any off-script comments from summit participants will drive short-term moves.
Devil’s Advocate
While the bearish case is compelling, the oversold RSI reading of 29.63 should not be ignored. In past instances, such extended readings have led to short-covering rallies, especially when combined with a key support level like $4,638. If gold manages to hold above $4,630 and reclaim the $4,655 area, the short-term bias could shift to neutral. A break above $4,700 would invalidate the bearish setup altogether, but that would require a material shift in the USD narrative or a surprise outcome from the Beijing summit.
Trading Strategy for This Session
The data-driven approach from our AI analysis log recommends a sell entry near $4,650.98, with a stop loss at $4,675 and take-profit levels at $4,635, $4,610, and $4,580. Given the proximity filter that blocked an immediate entry at $4,650, the best approach is to watch for a bounce toward $4,650-4,655 and initiate a short there. If you prefer to automate this entry condition, our News Trading Bot can handle news-driven volatility and place orders based on your predefined rules.
Risk Management
With the RSI deeply oversold, there is a risk of a snap rally. Keep position size small — no more than 0.5% of your trading capital per trade. The stop loss at $4,675 is only 0.5% above the entry zone, offering a favorable risk-to-reward ratio if the trend persists. If the stop is hit, do not re-enter until price reclaims a clear bearish structure. Always use a trailing stop once TP1 is reached to lock in partial profits.
FAQ
Q: Why is gold falling today?
Gold is declining due to a strong US Dollar and hawkish Federal Reserve commentary. The absence of high-impact economic data leaves technicals in control, and the bearish EMA alignment continues to attract sellers.
Q: What is the key support level for gold this Asian session?
The immediate support is $4,638. If that breaks, the next major target is $4,600, followed by the $4,580 area. The 60-minute chart shows no strong support until $4,550.
Q: Is it a good time to buy gold?
Buying oversold conditions can be tempting, but the trend is firmly bearish. Aggressive buyers could wait for a confirmed bullish reversal above $4,700. Conservative traders should avoid catching a falling knife.
Q: How does the Trump-Xi summit affect gold?
The summit has not provided a clear catalyst for gold. While hopes of a trade deal reduce haven demand, the lack of progress also keeps uncertainty elevated. The net effect has been neutral to slightly negative for gold as the dollar gains.
Conclusion
The Gold price forecast May 15 2026 Asia open leans firmly bearish as long as price remains below $4,650. The $4,638 support is the battleground — a break opens the door to $4,580, while a hold could lead to sideways consolidation. Manage your risk, stay nimble, and let the trend be your guide. For a hands‑off approach, consider our daily Gold signal service to receive professional trade setups directly.
Trading Gold (XAU/USD) involves significant risk of loss. This content is for informational purposes only and does not constitute financial advice. Always conduct your own research and trade responsibly.