Gold Price Forecast: Week of April 25 – May 01, 2026 — Neutral Trap or Breakout Ahead?
Gold closed last week at $4,708.01, down 0.99% after touching a high of $4,832.90 and a low of $4,657.63. The weekly candle printed a bearish engulfing pattern after three consecutive bullish weeks, leaving the market in a technically neutral position. With RSI slipping to 46.34 and MACD still negative despite a bullish cross signal, traders are asking: is this a healthy pullback or the start of a deeper correction? We break down the key levels, fundamental backdrop, and actionable strategies for the week ahead. If you prefer to trade these moves automatically, consider using our AI Trading Bot that scans XAUUSD 24/7 and executes high-probability setups with an 83%+ win rate.
Last Week in Review
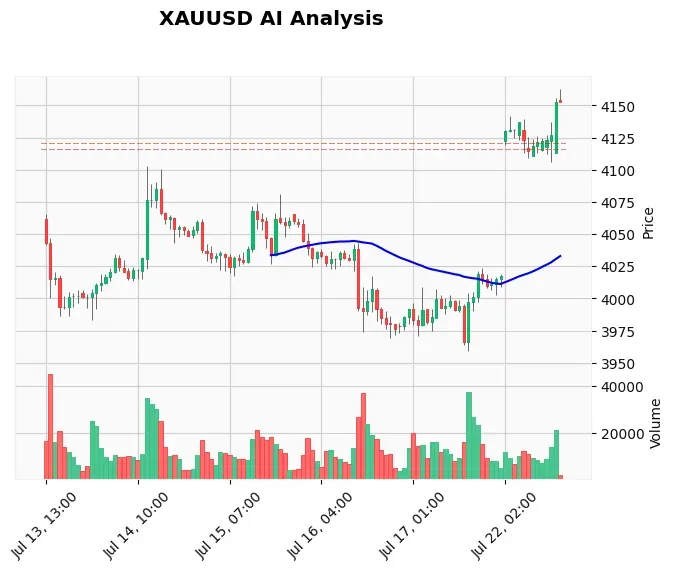
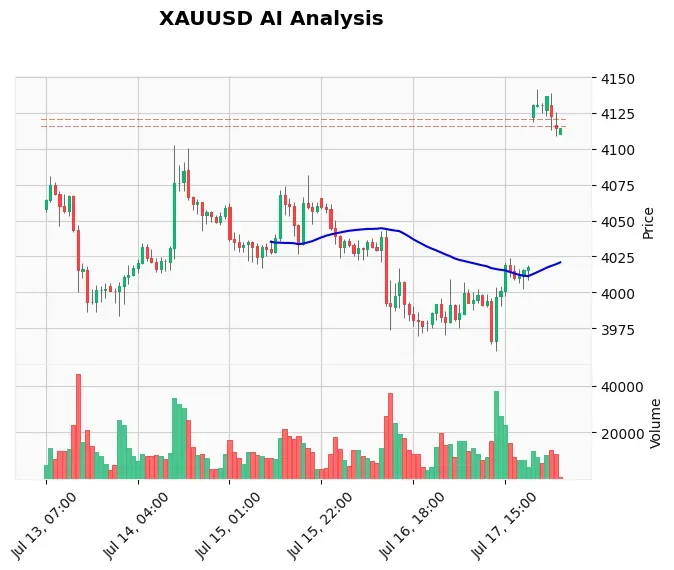
The week of April 18–24 saw gold open at $4,755.12 and initially rally to a new swing high of $4,832.90, driven by geopolitical tensions around the Hormuz strait and a weakening USD. However, resistance near the upper weekly Bollinger Band combined with overbought daily RSI readings triggered a sharp reversal. By Wednesday, sellers pushed prices below the EMA20 ($4,747.22) and EMA50 ($4,775.50), confirming a bearish short-term structure. The decline accelerated through Thursday, hitting a low of $4,657.63 before partial recovery into the close. The final candle settled near the week's midpoint, forming a doji-like body, which often signals indecision. Volume increased on the down days, suggesting selling was aggressive, but the failure to close below $4,700 keeps the bullish narrative alive for now.
Fundamentally, the week was dominated by Asian currency interventions (BSP rate hike, PBoC steepening) and a resilient dollar index hovering near 104.5. Gold's safe-haven bid was offset by rising real yields after stronger-than-expected US jobless claims data. The AI analysis log issued a cancel instruction for Signal 1667, closing a pending long setup, indicating that the automated system saw risk of further downside.
Weekly Technical Outlook
Moving Averages
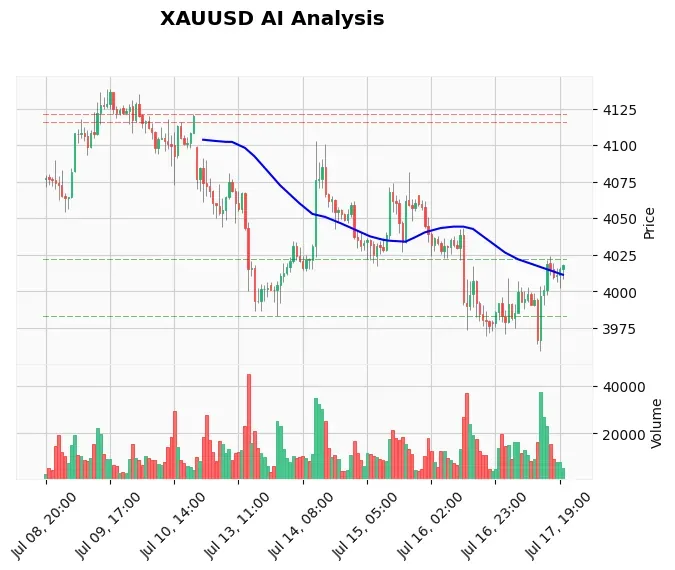
The EMA structure is currently bearish after last week's breakdown: fast EMA20 ($4,747.22) sits below the EMA50 ($4,775.50), while the EMA200 remains far below at $4,316.99, indicating the long-term trend is still up. The weekly MACD line is at -16.59 with a signal line at -23.41. The histogram turned positive last week (cross from -21.3 to -16.59), which is a classic bullish divergence of momentum—new price low but higher MACD reading. This divergence often precedes a reversal, but it requires confirmation next week. The ATR is elevated at 127.10, meaning we can expect large intraday swings—any breakout attempt will likely be violent.
Key Support and Resistance Levels
From the daily/weekly data, the critical supports are S2 = $4,402.72 and the major weekly support S1 = $4,099.02. Between them, the $4,400–$4,500 zone contains the psychological $4,500, the 50% Fibonacci retracement from the March 2026 low to April high, and the 200-day SMA ($4,317). A break below $4,400 would be severely bearish, targeting $4,100. On the upside, resistance sits at R1 = $5,419.15 and R2 = $5,597.91. The $4,800–$4,850 area is immediate short-term resistance, followed by the recent high of $4,833. The weekly pivot around $4,755 (last week's open) is also a magnet.
RSI and Momentum
The weekly RSI at 46.34 is slightly below the 50 midline, indicating bearish momentum but not oversold. This leaves room for further downside (to 30–35) before we can call a bottom. However, the divergence with price suggests sellers may be exhausting. A bullish reversal would require a weekly close above $4,750 and RSI climbing back above 50.
Three Scenarios for the Week of April 25 – May 01
Bullish Scenario: Gold finds support near $4,650–$4,700 and rebounds to reclaim the EMA20/50 zone at $4,750. A break above $4,800 would target the recent high of $4,833 and then the psychological $5,000. Probability: 30%. Likelihood increases if the US dollar weakens on a disappointing GDP print or if Hormuz tensions escalate further. Target: $4,833 / $5,000.
Bearish Scenario: Continued selling breaks below $4,657, targeting $4,500 and then S2 at $4,402.72. A weekly close below $4,400 would signal a trend reversal to the downside. Probability: 40%. Bearish catalysts include a stronger dollar, higher real yields from hawkish Fed commentary, or a de-escalation in geopolitical risks.
Neutral Scenario: Gold trades in a $4,650–$4,800 range with no clear breakout. RSI oscillates around 45–50, and the EMA20/50 entanglement continues. This is typical when no high-impact economic data is scheduled. Probability: 30%.
Fundamental Outlook
The coming week is exceptionally quiet on the US economic calendar—zero high-impact USD events are scheduled. This means gold will be driven by technical factors, global risk sentiment, and currency cross‑currents. The Asian news flow from last week (BSP rate hike, PBoC policy, USD/SGD Hormuz risks) will continue to influence the dollar index. The DXY is stuck near 104.5–105.0, and a break in either direction will likely dictate gold's next move. Additionally, gold traders should monitor the weekly US jobless claims and the April consumer confidence report, which could surprise markets. Without a clear catalyst, price action may remain choppy and sensitive to intraday headlines. For traders who prefer automated execution during news, our News Trading Bot can capture spikes around surprise releases.
Economic Calendar: April 25 – May 01, 2026 (USD High-Impact Events)
| Date | Event | Previous | Forecast | Impact |
|---|---|---|---|---|
| No events | — | — | — | Low |
A quiet calendar often leads to technical trading and mean reversion. Without fundamental news, the market is vulnerable to false breakouts and stop-hunts. Exercise caution when entering breakout trades; wait for a daily close above $4,800 or below $4,650 for confirmation.
Gold Trading Strategy This Week
Swing Trade (3–5 day hold)
Given the neutral bias and large ATR, a swing trade from the lower end of the range is attractive. Buy zone: $4,620–$4,660 (just below last week's low, where a double bottom may form). Stop loss: Below $4,580 (1.5 x ATR). Take profit 1: $4,750 (EMA zone). TP2: $4,830 (resistance). Risk/reward ~1:3. If price breaks below $4,650 and stays, flip short with target $4,500.
Day Trade (Intraday – 4h chart)
Focus on the 4-hour chart. Key resistance: $4,750 (former support turned resistance). Key support: $4,657 (Monday low). Wait for an impulsive move and retest. For long: a 4h close above $4,720 with RSI >50; target $4,780. For short: a 4h close below $4,680; target $4,620. Since volatility is high, reduce position size to 0.5% risk per trade. If you want to execute these setups without staring at charts, you can mirror signals instantly with our Telegram signal copier.
Risks to Watch
The biggest risk this week is a false breakout. With no data to confirm direction, an initial move above $4,800 could be trapped by sellers waiting at the prior high. Similarly, a dip to $4,600 might attract bargain hunters, leading to a quick reversal. Another risk is a sudden escalation of the Hormuz crisis, which could spike gold above $5,000 in a knee-jerk reaction—but such moves are often short-lived. On the flip side, a surprise hawkish comment from a Fed official (even off the calendar) could send gold crashing through $4,500. Always use a stop loss and avoid overleveraging.
FAQ – Gold Price Forecast Week of April 25, 2026
Q: What is the gold price forecast for this week?
A: Gold is expected to trade in a $4,650–$4,800 range with a neutral to slightly bearish bias. The MACD bullish divergence and RSI near 45 suggest sellers may be exhausted, but without a catalyst, a clear breakout is unlikely. Key levels to watch are support at $4,402 and resistance at $4,833.
Q: Will gold go up or down next week?
A: Based on the weekly technical outlook, gold has a 40% probability of declining toward $4,500, a 30% chance of rallying to $4,833, and a 30% chance of staying range-bound. The direction will likely be determined by the US dollar and risk appetite.
Q: Is gold a buy now or wait?
A: It is prudent to wait for a confirmation before entering a long position. A daily close above $4,750 with increasing volume would be a buy signal. Alternatively, a dip to $4,620–$4,660 with a bullish reversal candlestick offers a better risk/reward entry for swing traders.
Q: What is the impact of the quiet economic calendar on gold?
A: A quiet calendar reduces the chance of sudden fundamental shocks, allowing technical patterns to play out. However, it can also lead to low liquidity and erratic price spikes. Traders should rely on key support/resistance levels and avoid chasing momentum.
Q: What are the strongest support and resistance levels for gold?
A: The strongest weekly support is $4,402.72 (S2), followed by $4,099.02 (S1). On the upside, resistance at $5,419.15 (R1) is the first major barrier, though a weekly close above $4,833 is required to consider a bullish breakout. The 200-week EMA at $4,317 is an additional long-term support.
Q: Should I use a stop loss when trading gold this week?
Absolutely. With an ATR of 127 points, a 100‑pip stop is reasonable but could be hit by normal volatility. Use a stop of at least 150 pips on swing trades and consider trailing stops. For day trades, a 50‑pip stop is acceptable if entries are near key levels.
Conclusion
The week ahead for gold is a classic neutral setup after last week's bearish close. The lack of high-impact economic data means price action will be driven by technical levels and sentiment. While the MACD bullish divergence gives hope for a recovery, gold must reclaim the EMA20/50 zone quickly to avoid a deeper slide to $4,400. As a trader, your best approach is to wait for a clean breakout or a high-probability reversal at the extremes. No matter your style, having a reliable system can remove the guesswork. Our AI Trading Bot can help you stay on the right side of the trade—automated, disciplined, and profitable. Stay patient, manage risk, and trade the plan.
Trading Gold (XAU/USD) involves significant risk of loss. This content is for informational purposes only and does not constitute financial advice. Always conduct your own research and trade responsibly.