Gold Price Forecast April 21 2026 Asia Open: Bulls Face Key Resistance Test
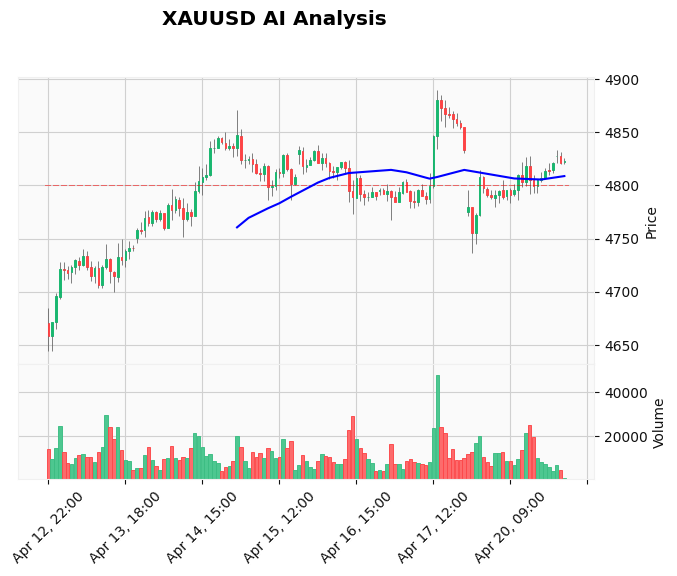
Gold price forecast for the April 21 2026 Asia open presents a cautious picture. The metal is holding just above the $4,820 mark early Tuesday, but bulls are running into a familiar wall of resistance. With price currently at $4,824.17, the immediate ceiling at $4,838.31 is the level to watch for any breakout attempt. However, the technical and fundamental landscape suggests a defensive posture may be prudent for the next 12 hours. A major USD catalyst—US Retail Sales data—looms over the European and US sessions, creating a strong headwind that could pressure gold lower. For traders looking to navigate this high-risk setup without the emotional strain, our AI Trading Bot executes strategies 24/7, managing entries, stops, and targets based on real-time market logic.
Gold Market Overview
Gold is trading in a tight $14 range as the Asian session gets underway, reflecting the typical low-volatility environment of this time zone. The price is caught between underlying bullish structural support and immediate technical resistance. The daily trend remains constructive, but the higher timeframe momentum is being challenged by a looming fundamental event. The US Dollar is finding bids in anticipation of the Retail Sales release later today, with forecasts pointing to a significant acceleration in consumer spending (1.4% vs. 0.6% prior). This has capped gold's upside for now. Additionally, geopolitical tensions, a traditional driver of safe-haven flows, have moderated with news of a potential US-Iran ceasefire, further removing a tailwind for the metal. The dominant theme this Tuesday is one of hesitation ahead of scheduled, high-impact US economic data.
Technical Analysis
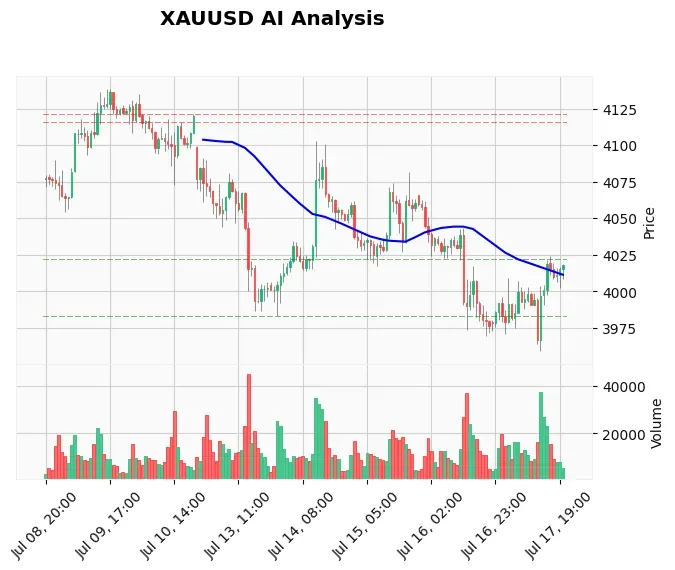
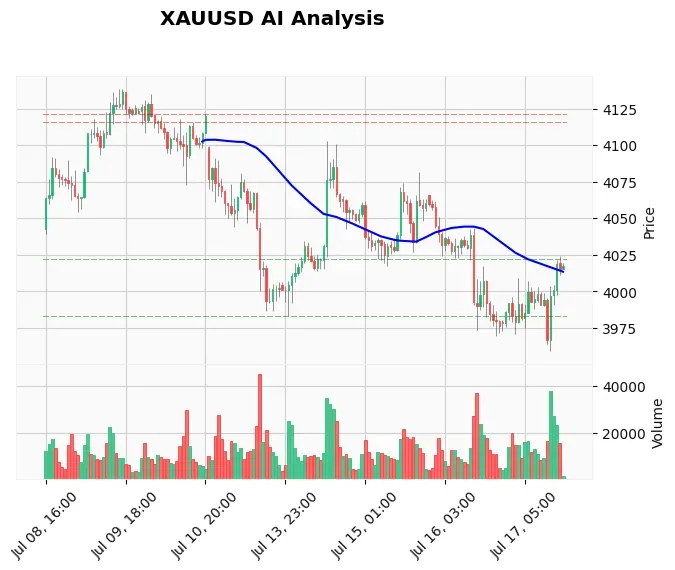
The technical setup reveals a market at a potential inflection point. On the daily chart, the bullish structure is intact with price trading comfortably above the key moving averages. The EMA-20 at $4,811.90 and EMA-50 at $4,809.15 are providing dynamic support below the current price. However, the more immediate hourly chart tells a story of struggle. Price has been rejected from the vicinity of the $4,850 psychological level and has formed a lower high, accompanied by bearish RSI divergence. This divergence signals that upward momentum is waning. The nearest resistance, derived from our live TradingView data, is at $4,838.31 (R2). A clean break and close above this level would negate the short-term bearish divergence and open a path toward the primary resistance at $4,889.44. On the downside, the immediate support confluence lies between $4,780 and $4,765, aligning with a previous swing high and a bullish trendline. The broader technical supports from the webhook are at $4,737.07 (S1) and $4,644.34 (S2). The RSI at 56.52 is in neutral territory but showing signs of rolling over on the lower timeframes.
Fundamental Drivers
The fundamental picture is dominated by a single, high-stakes event: the US Retail Sales report for March, due in approximately 11.5 hours. The market consensus expects a sharp rebound to 1.4% month-over-month, more than double the previous reading of 0.6%. Strong retail sales data would reinforce the narrative of a resilient US consumer and potentially harden expectations for a "higher-for-longer" Federal Reserve interest rate stance. This is inherently negative for non-yielding gold. Adding another layer of risk is the scheduled testimony from Fed Chairman-Designate Kevin Warsh shortly after the data release. His views on inflation and monetary policy discipline could further sway market sentiment. While headlines about Iran provide background noise, the scheduled economic calendar is the primary driver for today's price action. Trading around such events requires precision; our specialized News Trading Bot is designed to parse high-impact news and execute trades within milliseconds, an edge that is nearly impossible for manual traders to achieve.
Devil's Advocate
While the setup favors a cautious or bearish bias, what could invalidate this view? A significant downside miss in the Retail Sales data is the most obvious catalyst for a gold surge. A print well below the 1.4% forecast could spark a rapid USD sell-off, propelling gold through the $4,838 resistance toward $4,850 and beyond. Similarly, if Fed nominee Warsh expresses concerns about economic growth or downplays inflation risks during his testimony, the market could interpret it as a dovish signal, benefiting gold. From a technical standpoint, a decisive hourly close above the $4,838.31 resistance level would signal that the bearish divergence has failed and that bulls have absorbed all selling pressure, potentially triggering a new leg higher. The key reversal level to watch for a bullish invalidation is therefore a sustained move above $4,840.
Trading Strategy for This Session
Given the confluence of technical resistance and a bearish fundamental catalyst on the horizon, the strategic bias for the Asian and early European session is neutral-to-bearish. The high-probability play is to wait for a reaction to the US data. Aggressive traders might consider a small, high-risk-reward short position on a retest of the $4,835-4,838 resistance zone, targeting a move down toward the $4,800-4,790 support area, with a tight stop loss just above $4,845. The more prudent approach, aligning with our AI log's "WAIT" signal, is to remain on the sidelines during the Asian lull. Patience will be rewarded with a clearer direction post-data. The ideal scenario for bulls would be a pullback to the strong support confluence between $4,780 and $4,765, where a bounce could offer a favorable long entry with a well-defined stop. For consistent strategy execution in such environments, consider our Price Action Pro EA, which identifies and trades key support and resistance levels automatically.
Risk Management
Today's session carries elevated event risk, making strict risk management non-negotiable. If taking a position ahead of the data, position size should be reduced by at least 50% compared to a normal trade to account for the higher volatility. A minimum risk-reward ratio of 1:2 should be sought. For any short setup, the stop loss must be placed above the recent swing high to avoid being stopped out by a false breakout. If the market moves against your position, do not average down. The correct action is to exit at the predetermined stop loss level and reassess. The period immediately after the data release can see extreme spreads and slippage; using pending orders instead of market orders can help control entry and exit prices.
FAQ
Q: Will gold go up or down during the Asian session on April 21?
A: The Asian session is likely to see limited, range-bound movement between roughly $4,815 and $4,835 as traders await the major US Retail Sales data later in the day. A decisive directional move is more probable during the European or US sessions after the news release.
Q: What is the key support level for gold (XAU/USD) today?
A: The most critical support zone is between $4,780 and $4,765. A break below $4,780 could trigger a deeper correction toward the next significant support at $4,737.07.
Q: How will US Retail Sales affect the gold price?
A: A stronger-than-expected Retail Sales figure (above 1.4%) is likely to boost the US Dollar and US Treasury yields, putting downward pressure on gold. Conversely, a weaker number could weaken the Dollar and provide a lift to gold prices.
Q: Is the testimony from Fed nominee Warsh important for gold traders?
A: Yes. As the potential next Fed Chair, his views on inflation, interest rates, and central bank independence will be scrutinized for clues about future monetary policy. A hawkish tone could pressure gold, while a dovish or cautious tone could support it.
Conclusion
The gold price forecast for the April 21 Asia open hinges on the battle between near-term technical resistance and a looming fundamental threat. Price action suggests bulls are struggling to maintain momentum as they approach the $4,838 barrier. With a high-impact USD event just hours away, the path of least resistance in the near term appears tilted to the downside, at least toward the key $4,780 support confluence. The most important level for traders to watch is $4,838.31—a break above it changes the short-term narrative, while a rejection confirms the cautious outlook. Navigating this requires discipline and a clear plan. Automating your trading with our best-selling Gold trading bot removes emotion and executes a predefined strategy regardless of market noise, helping you capitalize on setups like today's with consistency.
RISK DISCLAIMER
Trading Gold (XAU/USD) involves significant risk of loss. This content is for informational purposes only and does not constitute financial advice. Always conduct your own research and trade responsibly.