Gold Price Analysis – Asian Session | March 27, 2026 | Hawkish Fed Caps Rebound, $4,500 Key
Gold (XAUUSD) is caught in a tug-of-war this morning, trading around $4,498 after a volatile week dominated by hawkish signals from the Federal Reserve. The pressure from rising US Treasury yields continues to limit gold's upside, but recent price action suggests a possible rebound towards the $4,500 level. The Asian session is now underway, traders are carefully assessing the landscape, trying to gauge whether this is a genuine recovery or a temporary bounce before another leg down. Investor Tipster is here to break down the key levels and potential trading strategies to navigate these choppy waters. Understanding the nuances of the gold market today is crucial for making informed decisions.
MARKET OVERVIEW
Currently, XAUUSD is trading at $4,498.24, within a relatively tight range established overnight. The overall daily trend remains bearish, influenced by the hawkish tone from the Fed and the strength of the US dollar. The Dollar Index (DXY) continues to exert downward pressure on gold, maintaining its inverse correlation. Risk sentiment is mixed; while equities show some resilience, the bond market is reflecting concerns about future economic growth. Gold's safe-haven appeal is struggling to gain traction amidst the prevailing 'risk-off' mood, especially with the Fed signaling further interest rate hikes. The key to watch is whether gold can decisively break above the $4,500 resistance level during this session. Gold price analysis requires a close watch on these dynamics.
TECHNICAL ANALYSIS
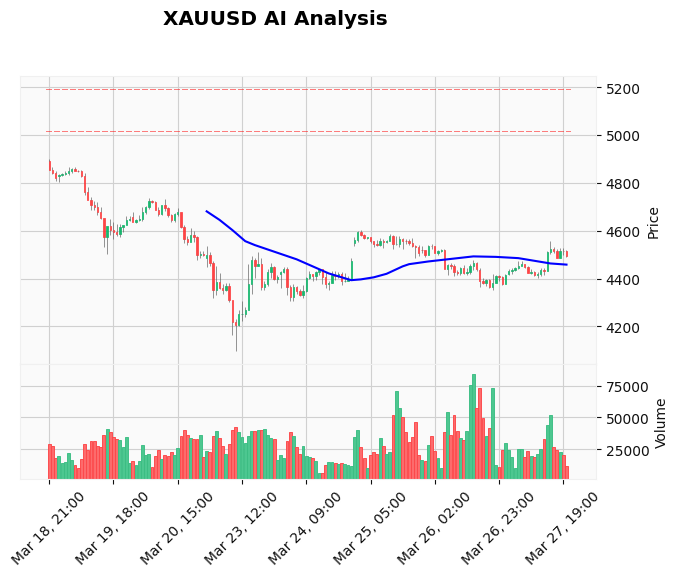
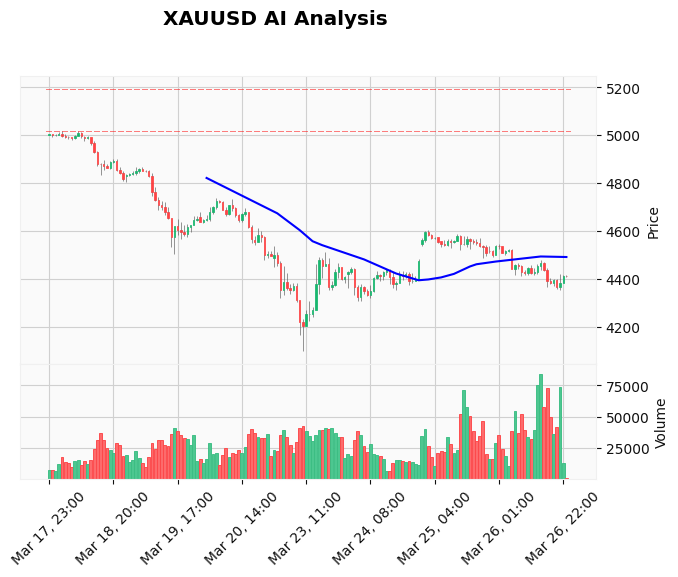
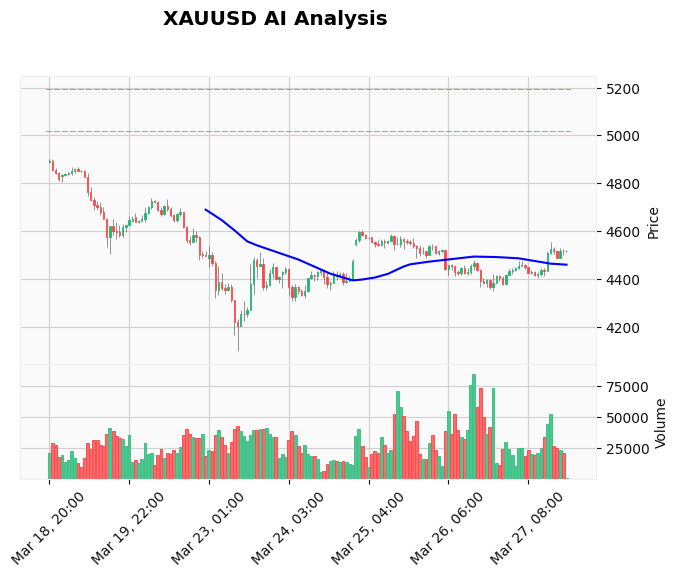
From a technical perspective, gold is at a critical juncture. Here are the key levels to monitor: * **Key Resistance 1:** $4,500 – A psychological level and a recent high. A break above this level could signal further upside. * **Key Resistance 2:** $4,560 – Represents the next major resistance zone, where sellers are likely to emerge. * **Key Support 1:** $4,448 – The current stop-loss level and a crucial defense for the bulls. A break below this level could trigger a significant sell-off. * **Key Support 2:** $4,400 – A strong support zone that has held in recent tests. This is also a psychological level. Indicator readings are mixed. The RSI is hovering around neutral territory, suggesting indecision. The MACD is showing a potential bullish crossover, but confirmation is needed. The price is currently oscillating around the 20-day EMA, further highlighting the lack of a clear trend. Some analysts suggest an ascending triangle is forming on the hourly chart, with resistance around $4,650 and support around $4,200. A confirmed breakout above $4,650 would be a strong bullish signal. Volume has been elevated in recent sessions, indicating increased market participation and volatility. [CHART IMAGE EMBEDDED HERE - From AI Log] Traders using the [AI Trading Bot](https://investortipster.com/marketplace/product/ai-trading/) had this level flagged automatically – the bot's 83%+ win rate on XAUUSD speaks for itself. The bot's AI scans for these patterns automatically, saving traders hours of manual work. Analyzing the gold price today requires these efficient tools.
FUNDAMENTAL ANALYSIS
The primary fundamental driver for gold remains the Federal Reserve's monetary policy. The recent hawkish comments from Fed officials have strengthened the US dollar and increased Treasury yields, putting downward pressure on gold. While there are no high-impact USD news releases scheduled for the immediate future, traders will continue to react to the prevailing sentiment and any further comments from Fed members. Geopolitical risks, particularly ongoing tensions in the Middle East, provide some support for gold's safe-haven appeal. However, this support is currently overshadowed by the strength of the US dollar and the prospect of higher interest rates. If you trade Gold around news events, the [News Trading Bot](https://investortipster.com/marketplace/product/news-trading/) is built exactly for this – it executes trades automatically during high-impact releases, capturing volatility spikes. The gold price analysis benefits greatly from tracking these news events.
DEVIL'S ADVOCATE – WHAT IF WE'RE WRONG?
Before committing to a bullish bias, it's crucial to consider the bearish scenario. The primary risk is a continuation of the Federal Reserve's hawkish stance, leading to a further strengthening of the US dollar and a decline in gold prices. If XAUUSD breaks decisively below the $4,448 support level, a significant sell-off could ensue, targeting the $4,400 and potentially the $4,300 levels. A break below $4,300 would invalidate the potential ascending triangle pattern and confirm a bearish continuation. Furthermore, any unexpected positive economic data from the US could further strengthen the dollar and weaken gold. Therefore, traders should exercise caution and be prepared to adjust their positions if the market breaks below key support levels. Conducting a thorough gold price analysis helps mitigate these risks.
TRADING STRATEGY FOR ASIAN SESSION
Given the current mixed signals, a cautious approach is warranted for the Asian session. The recommended strategy is to wait for a clear breakout or breakdown from the current range before initiating a trade. A break above $4,500, confirmed by strong volume, could signal a bullish opportunity. In this case, consider a long entry with a stop loss at $4,448 and take profit targets at $4,560 and $4,600. Conversely, a break below $4,448 could indicate a bearish continuation. In this scenario, consider a short entry with a stop loss at $4,500 and take profit targets at $4,400 and $4,300. Always adhere to sound risk management principles, risking no more than 1-2% of your trading capital on any single trade. This gold price analysis demands patience and precision. If you trade Smart Money Concepts, the [Price Action Pro EA](https://investortipster.com/marketplace/product/price-action-pro/) is cloud-based and catches these institutional moves automatically.
CONCLUSION & OUTLOOK
In summary, gold is currently in a state of indecision, influenced by conflicting forces: a hawkish Federal Reserve and potential geopolitical risks. The $4,500 level is critical. A break above it may signal a bullish continuation, while a break below $4,448 could lead to further downside. For the remainder of the Asian session, watch for a decisive move out of the current range and adjust your trading strategy accordingly. A well-informed gold price analysis helps to make the most of any trading opportunity. Want Gold signals like this delivered automatically? Our [AI Trading Bot](https://investortipster.com/marketplace/product/ai-trading/) runs 24/7, analyzes technicals AND fundamentals, and has maintained an 83%+ win rate on XAUUSD. It does the work while you sleep. New to trading? Start with our [Gold Trading Courses](https://investortipster.com/courses/courses/) and build a strategy that actually works. Running EAs around the clock? You need a reliable [Windows VPS](https://investortipster.com/vps/) so your bot never misses a trade. ⚠️ Risk Warning: Gold trading involves significant risk. Past performance is not indicative of future results. Never trade with funds you cannot afford to lose. This article is for educational purposes only and does not constitute financial advice.