Gold Price Analysis – American Session | March 28, 2026 | Hawkish Fed Sidelines Gold as $4,500 Looms
Gold (XAUUSD) finds itself on the defensive as the American session gets underway, trading near $4,550 after failing to sustain an early bounce. The relentless pressure from a hawkish Federal Reserve, coupled with diminishing safe-haven demand, continues to weigh on the precious metal. Will the $4,500 level provide support, or is further downside on the cards?
Today's Investor Tipster analysis dives into the key technical levels, fundamental drivers, and trading strategies to navigate this challenging market. We'll also explore the bearish scenarios that could unfold. Stay tuned to see whether Gold can hold its ground or if the bears will seize control.
MARKET OVERVIEW
As the American session kicks off, Gold is trading around $4,550, having oscillated within a relatively tight range. Earlier attempts to rally were quickly met with selling pressure. This highlights the underlying bearish sentiment currently gripping the market.
The dominant trend on the daily timeframe remains bearish, a view reinforced by the Federal Reserve's hawkish stance on interest rates. The US Dollar Index (DXY) is showing strength, further compounding the negative pressure on Gold. This inverse relationship between the DXY and Gold is a key factor to watch.
Overall, market sentiment leans towards risk-off, but the support for Gold isn't as strong as it would normally be during risk-averse periods. This suggests that the hawkish Fed narrative is currently overriding traditional safe-haven dynamics. Gold price analysis suggests further falls.
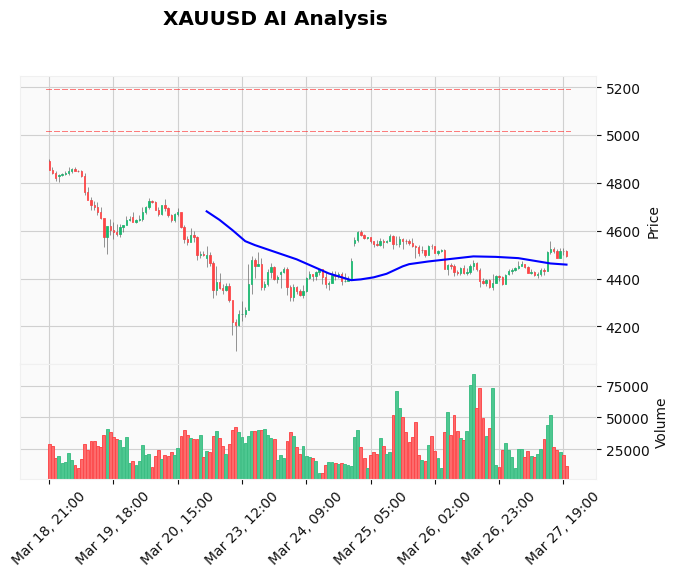
TECHNICAL ANALYSIS
From a technical perspective, Gold faces significant headwinds. Key support levels to watch are $4,500, followed by $4,450 and $4,400. A break below $4,500 could trigger a sharp sell-off, potentially testing the lower levels.
On the upside, immediate resistance lies around $4,600, followed by $4,650 and $4,700. Overcoming these resistance levels would require a significant shift in market sentiment. At the moment, any rallies appear to be opportunities for sellers to enter the market.
The Relative Strength Index (RSI) on the H4 chart is hovering around neutral, suggesting that Gold is neither overbought nor oversold. The Moving Average Convergence Divergence (MACD) is currently in bearish territory, reinforcing the downward bias. The price is also consolidating around the moving average, which doesn't give much indication of upward movement.
Traders using the AI Trading Bot had this level flagged automatically — the bot's 83%+ win rate on XAUUSD speaks for itself. The chart shows that XAUUSD has been trading in a tight range after a downtrend.
FUNDAMENTAL ANALYSIS
The primary driver behind Gold's recent weakness remains the Federal Reserve's commitment to fighting inflation through aggressive monetary policy tightening. Comments from Fed officials continue to signal further interest rate hikes in the coming months.
This hawkish stance is boosting the US Dollar, making Gold less attractive to international investors. Additionally, rising US Treasury yields are increasing the opportunity cost of holding non-yielding assets like Gold. Gold price analysis is always tightly coupled with what the Fed is doing.
While geopolitical tensions in the Middle East are typically supportive of Gold prices, the safe-haven demand has been muted. This suggests that investors are more concerned about the impact of rising interest rates on the global economy.
If you trade Gold around news events, the News Trading Bot is built exactly for this — it executes trades automatically during high-impact releases.
DEVIL'S ADVOCATE — WHAT IF WE'RE WRONG?
Despite the prevailing bearish sentiment, it's crucial to consider the potential for a bullish reversal. Several factors could invalidate the current downtrend. Let's consider this gold price analysis from the bullish perspective.
A significant escalation of geopolitical tensions in the Middle East could trigger a surge in safe-haven demand, pushing Gold prices higher. A dovish shift in the Federal Reserve's policy stance, perhaps in response to weaker-than-expected economic data, could also provide a boost to Gold.
Technically, a break above the $4,700 resistance level would signal a potential trend reversal. This would require a concerted effort from buyers and a weakening of the US Dollar. This scenario needs to be watched for.
Here's the bearish case you need to watch: should Gold break below $4,500, expect accelerated selling pressure that could test $4,400 swiftly. This break would signal a continuation of the downtrend and confirm the bearish outlook.
TRADING STRATEGY FOR AMERICAN SESSION
Given the current market conditions, a cautious approach is warranted for the American session. The AI trading bot advised to WAIT. Consider SELL LIMIT orders at $4,600. The primary strategy is to monitor for further selling opportunities.
Look for a break below the $4,530 level as an entry trigger. Place a stop loss just above $4,600 to protect against unexpected rallies. Target initial profit at $4,500, with a second target at $4,450.
Remember to adhere to strict risk management principles. Never risk more than 1-2% of your trading capital on any single trade. It is imperative to manage risk, especially with gold price analysis.
If you trade Smart Money Concepts, the Price Action Pro EA is cloud-based and catches these institutional moves automatically.
CONCLUSION & OUTLOOK
Gold is facing significant headwinds as the American session unfolds, pressured by a hawkish Federal Reserve and muted safe-haven demand. The outlook remains bearish, with the $4,500 level serving as a critical support zone. A break below this level could trigger a further sell-off.
Traders should closely monitor the US Dollar Index and any news headlines related to Fed policy or geopolitical events. Watch for volatility as the session unfolds. Gold price analysis continues to be critical.
Want Gold signals like this delivered automatically? Our AI Trading Bot runs 24/7, analyzes technicals AND fundamentals, and has maintained an 83%+ win rate on XAUUSD. It does the work while you sleep.
New to trading? Start with our Gold Trading Courses and build a strategy that actually works.
Running EAs around the clock? You need a reliable Windows VPS so your bot never misses a trade.
⚠️ Risk Warning: Gold trading involves significant risk. Past performance is not indicative of future results. Never trade with funds you cannot afford to lose. This article is for educational purposes only and does not constitute financial advice.

