Gold Live Analysis May 19 American Market Break Below $4,520
The New York session opens with a clear bearish bias as gold has sliced through the $4,520 support zone during early European hours. At the time of writing, XAU/USD trades at $4,504, down 0.7% on the day, and momentum favors further downside. The breakdown is confirmed by a 60-minute close below $4,520, and sellers are now targeting the next major demand area near $4,480. If you want to trade this breakdown automatically without staring at the screen, our AI Trading Bot is already positioned to capture the move with its real-time signal engine.
Gold Market Overview
The broader market sentiment remains heavily tilted against gold. The US Dollar Index (DXY) is pushing fresh weekly highs, Treasury yields are climbing on renewed Fed hawkish bets, and risk appetite is waning. The US-Iran ceasefire talks have temporarily cooled geopolitical fears, removing a key safe-haven bid from gold. Meanwhile, expectations for a June rate hike have risen above 60%, putting additional pressure on the non-yielding metal. The FOMC minutes due Wednesday are the next major catalyst, and traders are pricing in a more aggressive path. For now, every rally in gold is being sold into aggressively.
Technical Analysis
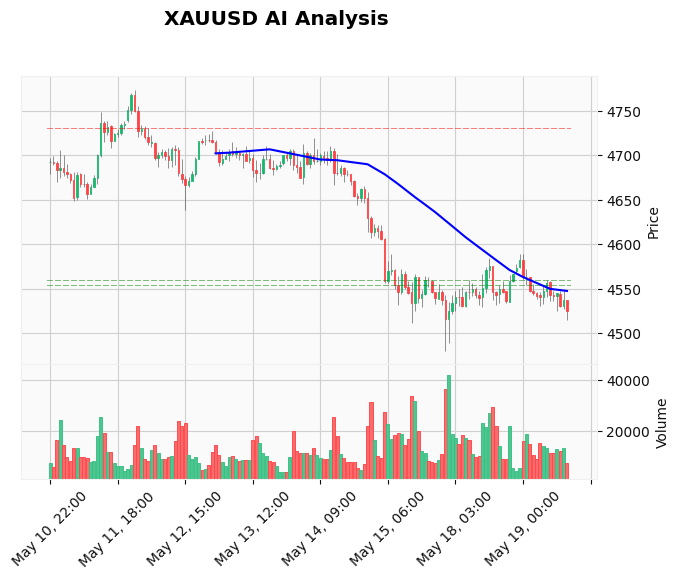
The daily chart turned bearish last week, and short-term timeframes are now confirming the shift. The 20 EMA ($4,543) crossed below the 50 EMA ($4,561) on Monday, forming a classic 'death cross' on the hourly. The 200 EMA sits far above at $4,623, meaning the path of least resistance is lower. The RSI on the 60-minute chart is at 33.92 — oversold but flattening, which often precedes a capitulation push rather than an immediate reversal. The MACD remains deep below its signal line with a bearish histogram. Support is clear at $4,480 (S1 from TradingView data), with a secondary target at $4,463 (previous weekly low). Resistance comes in at the broken $4,520 level, then the 20 EMA near $4,543. ATR of $22.58 suggests room for a $50 range today. As the chart below shows, price action is making lower highs and lower lows — a textbook downtrend. For algorithmic assistance, check our collection of automated Gold robots that trade these precise setups.
Fundamental Drivers
Three forces are aligning against gold today. First, the US Dollar remains bid on hawkish Fed repricing. Second, bond yields continue to climb — the 10-year yield is up 8 basis points to 4.92%. Third, the Iran ceasefire tailwind is removing safe-haven flows. The FOMC minutes release tomorrow (Wednesday, 18:00 UTC) will be scrutinized for any hint of a 50bp hike. Additionally, Canada's inflation rate accelerated to 2.8% overnight, reinforcing the global inflation stubbornness theme. Until we see a dollar reversal or a fresh geopolitical shock, gold is likely to remain under pressure. For traders who prefer event-driven entries, consider using our automated gold news bot to react instantly to Fed minutes.
Devil's Advocate
The biggest risk to this bearish view is a short squeeze. RSI is oversold, and extreme sentiment readings in the futures market suggest could be ripe for a snap-back rally. If gold holds $4,480 and produces a bullish engulfing candle on the 4-hour chart, a move back toward $4,520-$4,540 is possible. Also, any unexpected escalation in Middle East tensions — even just a rumor — could reverse the safe-haven outflow. Traders should have a stop above $4,520 to protect against a false breakdown.
Trading Strategy for This Session
Given the strong bearish confluence, the best play is a sell stop order at $4,499 (just below the current price to confirm continuation). Stop loss should be placed at $4,521 — above the former support that now acts as resistance. Take profit targets: TP1 at $4,480 (round number and key support), TP2 at $4,463, and a runner to $4,440 if momentum persists. Risk management is critical: limit risk to no more than 1% of account equity. If the stop is hit, reassess — a close above $4,520 would invalidate the breakdown scenario. For a hands-off approach, our Price Action Pro EA can automatically execute this sell-stop strategy with predefined risk parameters.
Risk Management
This is a high-conviction setup, but never treat it as a sure thing. The most important rule is to respect your stop loss. With a 1:2 risk-reward ratio (20 ticks risk vs 40 ticks initial target), this trade is mathematically favorable. If the trade moves against you immediately, get out — do not hope for a reversal. For larger positions, scale in at $4,499 and $4,490 to achieve a better average entry. Always calculate position size based on your stop distance and account size.
Frequently Asked Questions
Q: Is $4,480 a strong support for gold today?
A: Yes, $4,480 is the first downside target identified by TradingView's support algorithm. It also aligns with a psychological round number and a previous hourly swing low from last week. A break below $4,480 would open the door to $4,463 and then the $4,400 handle.
Q: Why did gold break below $4,520?
A: The trigger was a combination of USD strength and falling safe-haven demand as Iran ceasefire talks progress. Technically, sellers overcame the $4,520 support after failing to hold above the 20 EMA. Momentum is firmly bearish.
Q: What is the best entry for a short trade right now?
A: A sell stop at $4,498-$4,499 with a stop at $4,521 offers a clean risk-reward ratio. Wait for price to take out the recent low near $4,504 to confirm continuation. Avoid chasing the move.
Q: How should I trade FOMC minutes with this gold setup?
A: The FOMC minutes (Wednesday) can cause sharp reversals. If you are in a short trade before, consider taking partial profits before the release or moving stop to breakeven. For news-driven plays, use a dedicated News Trading Bot to handle volatility.
Conclusion
Gold's breakdown below $4,520 is a textbook bearish breakout that aligns with macro headwinds and technical deterioration. The immediate target is $4,480, and a close below that could accelerate selling toward $4,440. However, respect the risk of a short squeeze and always use a stop. The biggest opportunity today is following the trend with discipline. To automate this entire process and never miss a setup, try our best-selling Gold trading bot — it trades XAUUSD around the clock with an 83% win rate.
Trading Gold (XAU/USD) involves significant risk of loss. This content is for informational purposes only and does not constitute financial advice. Always conduct your own research and trade responsibly.