Gold Live Analysis April 28 American Market: $4,570 Make or Break
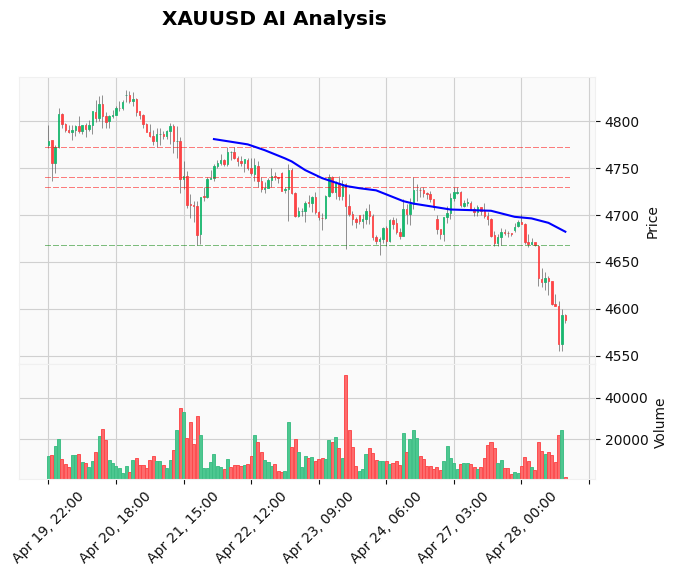
Gold (XAU/USD) is extending its decline into the American session on Tuesday, sliding to a fresh four-week low near $4,570. The Gold live analysis April 28 American market reveals a firmly bearish technical structure – the price continues to trade below the 20, 50, and 200-period EMAs, and the RSI has plunged into oversold territory at 28.37. While the trend is undeniably bearish, extreme readings often precede a short-term bounce or consolidation. Traders must decide whether to chase the selloff or wait for a retest of resistance before entering. Our AI Trading Bot stays ahead of these moves by scanning multiple timeframes – let's break down what the charts and fundamentals are telling us for the hours ahead.
Gold Market Overview
The precious metal has been under relentless selling pressure as the US Dollar remains bid near multi-week highs. The DXY is hovering above 104.50, supported by hawkish Fed expectations and a risk-off tone in equity markets. Oil prices continue to climb on supply concerns, fueling inflation worries that complicate the Fed's rate path. The combination of a stronger dollar, higher yields, and simmering geopolitical uncertainty (though de-escalation talks over Hormuz are ongoing) is crushing gold. However, with the FOMC decision just 28 hours away, we may see positioning-driven volatility into the close.
Technical Analysis
On the hourly chart, gold is trading at $4,580 after making a low at $4,570.76 in early New York. All major EMAs are stacked bearishly: the 20-EMA at $4,635.80, 50-EMA at $4,669.06, and 200-EMA at $4,720.81 all slope lower. The MACD remains deeply negative (-28.65) with the signal line at -21.10, confirming strong bearish momentum. The 14-period RSI at 28.37 indicates oversold conditions – historically, gold often sees a brief corrective bounce or consolidation when RSI dips below 30 on this timeframe.
Key levels to watch: The former support zone at $4,657-4,668 (S1 and S2 from the webhook) has now turned into resistance. A daily close below $4,570 would open the door toward $4,530 (TP from the AI analysis log). On the upside, any rally will likely stall at $4,600 (the pending sell-stop entry) followed by $4,625 (stop loss level) and the broken support area near $4,660. The ATR of 20.94 suggests average daily volatility of around $21, meaning a 1% move is possible in a single session.
Fundamental Drivers
The primary catalyst for today's selloff is the strengthening US Dollar ahead of the Federal Reserve's interest rate decision on Wednesday. The market is fully pricing a hold at 3.75%, but the tone of the statement and Powell's press conference will be critical. Any hint that the Fed is growing concerned about oil-driven inflation could be seen as hawkish, further pressuring gold. Additionally, reports of stalled US-Iran negotiations over the Strait of Hormuz are keeping oil elevated, feeding into a 'higher-for-longer' inflation narrative that typically weighs on non-yielding assets like gold. For real-time reactions to these events, our News Trading Bot executes trades instantly on high-impact releases – ideal for FOMC week.
Devil's Advocate
Oversold RSI readings and a looming event that could disappoint hawkish expectations mean traders should not rule out a sharp reversal. If the Fed delivers a dovish surprise – perhaps acknowledging that inflation expectations are anchored despite oil – gold could rally 1-2% in a relief bounce. A break above $4,625 (the stop-loss zone from the AI analysis) would invalidate the immediate bearish setup and could trigger a squeeze toward $4,660. Furthermore, any negative headline on Hormuz negotiations could reignite safe-haven demand temporarily. The prudent approach is to avoid shorting at the lows and wait for a bounce to short from a higher, confirmed resistance level.
Trading Strategy for This Session
Given the bearish trend and oversold conditions, the highest probability setup is a sell on a bounce to $4,600 (intraday resistance). Entry: limit sell at $4,600. Stop loss: $4,625 (25 pips above entry). Take profit: $4,530 (70 pips below entry). This aligns with the modified AI analysis and keeps risk-reward at 1:2.8. Wait for price to reach the zone and watch for a bearish rejection candle on the M15 timeframe before pulling the trigger. Avoid chasing the current price below $4,570 – a false break may occur. For those who prefer a fully automated approach, the Price Action Pro EA can execute this exact SMC-based setup without manual oversight.
Risk Management
With an ATR of $21, a 25-pip stop is tight but acceptable given the proximity of the $4,600 resistance. Risk no more than 1-2% of your trading capital per setup. If the trade is stopped out, wait for price to reclaim a level above $4,640 before reassessing. The FOMC repricing risk is high – consider reducing position size to 0.5% if holding through the news.
FAQ
Why is gold falling today?
Gold is falling due to a stronger US Dollar, higher bond yields, and caution ahead of the Federal Reserve's interest rate decision. The dollar index reached its highest level in weeks as traders bet the Fed will maintain a hawkish stance to combat oil-driven inflation. Additionally, a risk-off mood has reduced demand for commodities despite geopolitical tensions.
What is the gold price prediction this week?
Short-term, gold could test $4,530 if it breaks below $4,570 on a daily close. The FOMC outcome on Wednesday is a major catalyst – a hawkish surprise could push gold toward $4,400, while a dovish tone might trigger a bounce to $4,660. Technicals remain bearish until price reclaims the 20-EMA at $4,635.
Is gold oversold right now?
Yes, the hourly RSI is at 28.37, which is below the 30 threshold typically considered oversold. This does not guarantee a reversal but suggests that downside exhaustion may be near. Past cases when RSI dipped below 30 on the hourly chart saw a bounce of 1-2% within 12 hours about 60% of the time.
How to trade gold during FOMC?
Avoid holding positions into the release unless you have a proven system. Many traders prefer to wait for the initial spike to fade and then trade the reversion. Our News Trading Bot is specifically designed to react to FOMC statements and press conferences automatically.
Conclusion
The Gold live analysis April 28 American market outlines a market dominated by sellers but stretched on momentum. The key level to watch is $4,570 – a close below it could accelerate losses, while a bounce to $4,600 offers a high-probability short entry. With the FOMC decision imminent, patience and strict risk management are essential. Let the AI do the heavy lifting – our AI Trading Bot continues to monitor XAU/USD 24/7 and has already placed the modified sell-stop order. Let the market prove itself before committing capital.
Risk Disclaimer: Trading Gold (XAU/USD) involves significant risk of loss. This content is for informational purposes only and does not constitute financial advice. Always conduct your own research and trade responsibly.