XAU USD Price Movement April 28 London Open: Bearish Momentum Meets Oversold Support
The XAU USD price movement April 28 London open extends a bearish run as gold trades near a three-week low around $4,630. Sellers have dominated since the Asian session, pushing the metal below the $4,640 handle amid a strengthening US dollar and cautious pre-FOMC positioning. With RSI deep in oversold territory at 27.4, the question now is whether a technical bounce materialises or if the slide accelerates toward $4,600. For traders who want to capture these moves automatically, our AI Trading Bot executes XAU/USD strategies 24/7 with an 83%+ win rate.
Gold Market Overview – April 28 European Session
Sentiment is heavily skewed bearish as the US Dollar Index (DXY) holds above 105.50, benefiting from a hawkish Federal Reserve stance and a weaker yuan after the PBOC fixed the USD/CNY rate at 6.8589, well above market estimates. Gold’s safe-haven demand remains muted despite ongoing US-Iran tensions, as traders instead focus on rate expectations. The FOMC decision in ~34 hours is the dominant macro catalyst, keeping gold sellers in control. European equity futures are mixed, offering no relief for risk-off flows into precious metals.
Technical Analysis – Oversold But Still Lower Highs
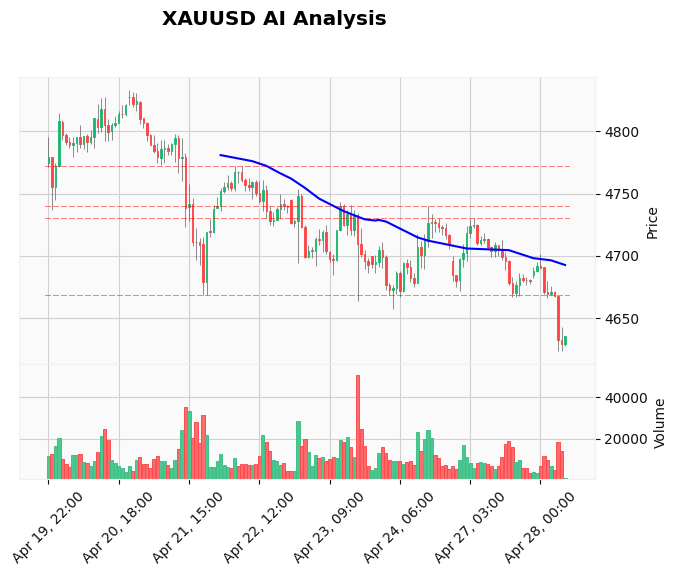
On the hourly chart, gold is printing a series of lower highs and lower lows after breaking below the $4,657 support (former support now resistance). The EMA structure is firmly bearish: price is below the EMA 20 ($4,670.78), EMA 50 ($4,689.21), and EMA 200 ($4,728.55). The RSI at 27.44 signals oversold conditions, which could slow the decline, but no bullish divergence has formed yet. The MACD line (-15.54) is below the signal line (-10.29) and deepening, confirming strong downward momentum. ATR of $15.29 suggests the current volatility is above average, which means sharp intraday swings are likely.
Immediate support is the session low at $4,620.36. A break below opens the door to $4,600 (psychological) and $4,550 (next major support, derived from AI analysis). On the upside, resistance is at $4,657.63 (former support turned resistance) and the EMA20 at $4,670.78. The price action as seen on the attached chart shows sellers rejecting every intraday bounce below $4,640, a classic sign of distribution.
Fundamental Drivers – USD Strength and FOMC Anticipation
The main bearish driver remains the strong US dollar. Markets are pricing no rate cut at this week’s FOMC meeting, and any hawkish language in the statement could propel the DXY higher, punishing gold further. In addition, the PBOC’s deliberate yuan weakening signals a competitive devaluation theme that supports the dollar. Meanwhile, US-Iran tensions have not triggered safe-haven buying for gold, likely because oil markets are absorbing the shock, and equities remain resilient. The next key event is the FOMC statement and press conference on April 29. Traders can trade those high-impact releases automatically with our News Trading Bot, designed to capture volatility around central bank decisions.
Devil’s Advocate – Why Bears Could Be Trapped
The oversold RSI is the strongest argument against chasing shorts here. Extended readings below 30 have often preceded sharp intraday bounces in gold, especially when combined with a potential short-term catalyst (e.g., a softer-than-expected US data point or an unexpected escalation in the Middle East). Furthermore, if the FOMC signals even a hint of concern about economic weakness, the dollar could reverse quickly, triggering a short squeeze. A break back above $4,657 would invalidate the current bearish bias.
Trading Strategy for This European Session
Given the strong trend and pre-FOMC uncertainty, a cautious approach is warranted. The AI Analysis Log recommends selling at current levels ($4,635) with a stop at $4,665 and targets at $4,600, $4,550, and $4,500. For intraday traders, a short entry near $4,635–$4,640 with a tight stop above $4,658 (former support) and a first target of $4,620 is reasonable. If support at $4,620 breaks, add to the short targeting $4,600. Conversely, any close above $4,658 would signal a potential false breakdown. For traders who prefer automation, our live Gold trading signals provide precise entries and exits throughout the session.
Risk Management – Protect Your Capital
With the FOMC less than two days away, position sizing should be reduced. The ATR of $15.29 means that a 1-lot trade on a stop of 30 pips could risk $300, so use micro lots or reduce leverage. If the trade moves in your favour to $4,620, trail the stop to breakeven. Never risk more than 1% of your account on a single setup. This disciplined approach separates professional gold traders from gamblers.
Q: What is the XAU USD price movement April 28 London open expected to do?
A: The early London open shows gold under heavy selling pressure near $4,630, with a bias toward testing $4,620 support. A breakdown below $4,620 could accelerate losses toward $4,600, while a bounce above $4,657 would suggest a false breakdown. The FOMC decision later this week remains the key uncertainty.
Q: Is gold oversold and due for a bounce in the European session?
A: The RSI at 27.4 is deeply oversold on the hourly chart, which historically increases the probability of a short-term bounce. However, in strong downtrends, oversold can persist longer than expected. Look for a bullish price rejection at $4,620 or a close above $4,657 to confirm a bounce.
Q: How does the FOMC decision affect gold during the London session?
A: Anticipation of the FOMC decision is already weighing on gold, as traders expect the Fed to keep rates unchanged with a hawkish tone. A hawkish outcome would strengthen the dollar and push gold lower, while a dovish surprise could trigger a rapid reversal. The London session will see positioning adjustments ahead of the event.
Q: What are the key support and resistance levels for gold on April 28?
A: Immediate support sits at $4,620 (session low), with a break opening $4,600 and $4,550. Resistance is at $4,657 (former support) and $4,670 (EMA20). A move above $4,670 would shift the bias to neutral, while above $4,728 (EMA200) would turn it bullish.
Q: Should I buy gold at current levels near $4,630?
A: Buying at $4,630 is risky given the strong bearish trend and USD strength. If you must buy, wait for a confirmed double bottom at $4,620 with a stop below $4,610. Alternatively, selling into rallies near $4,657 with a tight stop offers a better risk-reward.
Conclusion – Stay Cautious, Let the Levels Decide
The XAU USD price movement April 28 London open is clearly bearish, but the oversold extremes and upcoming FOMC risk mean that chasing the move at current levels carries significant risk. The key level to watch is $4,620 – a break keeps bears in full control, while a bounce could offer a quick counter-trend scalp. Whichever side you trade, use proper risk management and let the market prove itself. To automate your gold trading with a proven system, try the AI Trading Bot that trades XAU/USD 24/7 with an 83%+ win rate.
Disclaimer: Trading Gold (XAU/USD) involves significant risk of loss. This content is for informational purposes only and does not constitute financial advice. Always conduct your own research and trade responsibly.