XAUUSD US Session Forecast July 03: Is $4,200 the Next Gold Target?
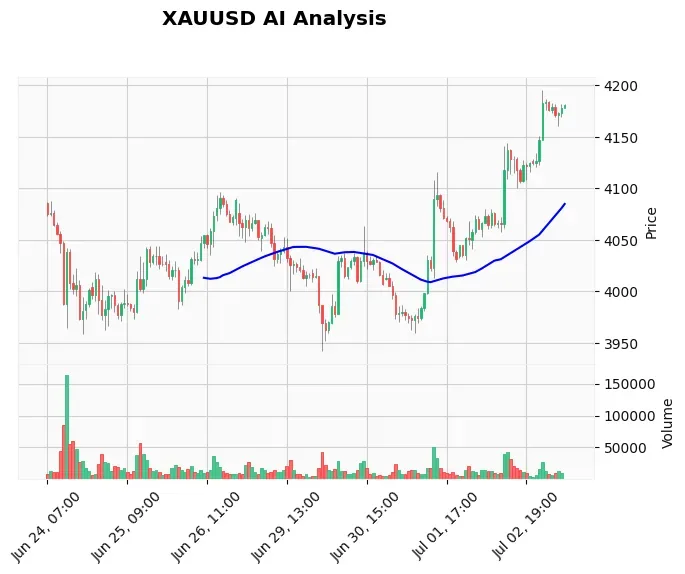
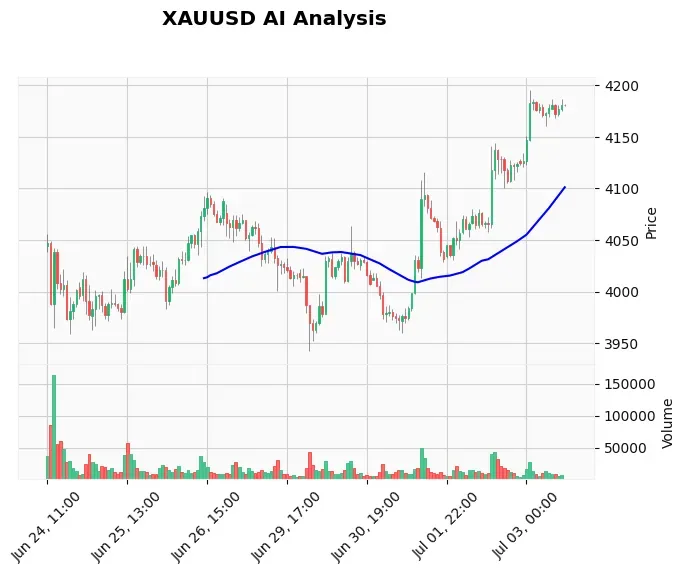
The XAUUSD US session forecast for July 03 finds gold knocking on the door of the $4,200 handle. After last Friday’s dismal US Nonfarm Payrolls crushed the dollar, XAU/USD now trades near $4,181—up for a third straight day and on track to snap a four-week losing streak. The overwhelming bearish dollar mood and evaporating Fed rate hike expectations have put bulls firmly in control. But as we enter the most volatile session of the day, the question is whether the momentum can break through the next big resistance or if an overbought market needs a breather. Our AI Trading Bot has already positioned for this move, holding a live long from $4,178.57 with a target at $4,220.
Gold Market Overview: Dollar Weakness Fuels Rally
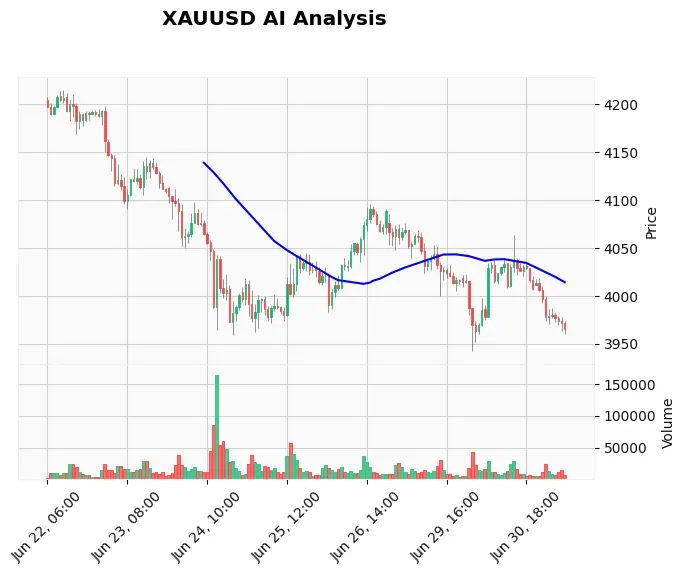
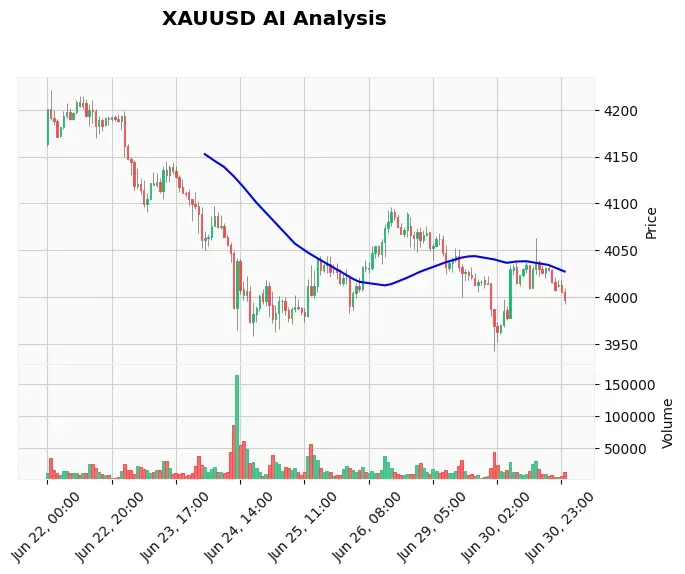
The macro backdrop is unequivocally gold-friendly. The US Dollar Index tumbled to multi-week lows after the NFP report showed a sharp slowdown in hiring. Markets swiftly repriced the Fed’s rate path: fewer than 50% now expect any hike this year, according to CME FedWatch. With the terminal rate effectively capped, the opportunity cost of holding zero-yield gold diminishes dramatically. TD Securities’ Bart Melek noted that the precious metal has firmly established a higher range above $4,100, buoyed by the dovish repricing. Meanwhile, Societe Generale pointed out that gold not only held the critical $3,930 support zone but has bounced vigorously, reinforcing the long-term uptrend. Geopolitical tensions and central bank buying continue to provide a supportive undercurrent.
Technical Analysis: Bulls Chipping at Resistance, Overbought Alerts Flash
From a technical perspective, the daily chart remains resolutely bullish. The 20-period EMA at $4,178.53, the 50 EMA at $4,167.40, and the 200 EMA at $4,109.50 all point higher, confirming a stacked bullish order. Today’s price action has stayed above the 20 EMA, a critical intraday support level. However, the 4‑hour RSI has climbed to 71, signaling overbought conditions. The MACD histogram has crossed slightly below the signal line, hinting that upward momentum is cooling. These mixed signals suggest the bull trend is intact, but a short‑term correction cannot be ruled out. Immediate resistance stands at $4,195.51, followed by the psychological $4,200 barrier. Beyond that, the previous weekly high at $4,221.37 is the next significant target. On the downside, a break below $4,178 would put the 50 EMA at $4,167 back on the radar, with $4,148 serving as the line in the sand for the current long trade. The 14‑day ATR at $6.25 implies a daily trading range of roughly $12–$15, making a test of $4,200 well within reach. The daily chart’s series of higher lows since late June reinforces the bullish structure, and any dip that holds above $4,167 will be viewed as a healthy consolidation before the next push higher.
Fundamental Drivers: Post‑NFP Euphoria Sustains Gold
The fundamental case for higher gold prices hasn’t changed since Friday. The NFP miss was the catalyst gold needed to escape the $4,050–$4,100 range. With no high‑impact US economic events on today’s calendar, the market’s focus remains on digesting the dovish implications. US 10‑year Treasury yields have retreated, and real yields are compressing—a classic fuel for gold rallies. The absence of fresh data could lead to a hold‑and‑wait attitude, but mild dollar weakness may persist, keeping a bid under XAU/USD. Traders looking to harness these fund-driven swings can use our News Trading Bot, which executes trades specifically around high‑impact data releases and economic themes.
Devil’s Advocate: Why a Pullback Could Surprise Bulls
Even in a strong uptrend, profit‑taking and technical exhaustion are real risks. The 4‑hour RSI above 70 coupled with a negative MACD histogram can often precede a sharp intraday correction. If the dollar stages even a modest corrective bounce—perhaps driven by end‑of‑week flows—gold could quickly recoil from $4,195 and head toward the $4,167 area. A break below that would call the $4,148 stop level into question and signal a deeper retracement toward $4,100. Furthermore, the M15 chart shows a bearish trendline break earlier this morning, indicating that shorter‑term speculators are already betting on a dip. Yet, the weight of the fundamental narrative makes any such pullback a probable buying opportunity rather than a trend reversal.
Trading Strategy for This Session: Buy the Dip or Catch the Breakout
Given the alignment of higher‑timeframe trends and robust fundamentals, the bias remains bullish. The current live long trade from $4,178.57 with a stop at $4,148.57 and a take‑profit at $4,220 provides a concrete roadmap. For those not yet positioned, consider buying on a pullback to the $4,178–$4,180 zone. Place a stop below $4,167 to protect against a sudden shift, with an initial target of $4,195 and a further target at $4,200–$4,220. Aggressive traders might wait for a confirmed 1‑hour close above $4,195 before entering, to avoid getting caught in a false breakout. To replicate such trading signals seamlessly, our Telegram Copier can automatically duplicate professional trade entries straight to your Metatrader platform.
Risk Management: Protect Capital in Volatile Conditions
A $30 stop loss (from $4,178 to $4,148) against a $42 take‑profit target gives a risk‑reward ratio of 1:1.4—marginally above breakeven. Yet by targeting $4,220 (a ~42‑point move), the ratio improves significantly. Risk no more than 1–2% of your account balance on this setup. Given the overbought RSI, scaling into the position rather than committing full size all at once is prudent. For those running automated strategies, a 24/7 Windows VPS guarantees your EAs remain active during crucial New York hours, even if your home internet falters.
Frequently Asked Questions
Q: What pushed gold to $4,181 today?
A: Gold’s rally is anchored in the aftermath of a weak US Nonfarm Payrolls report, which weakened the US Dollar and lowered the probability of further Fed rate hikes. This dovish shift increased demand for safe‑haven gold.
Q: Is $4,200 a major resistance for XAU/USD?
A: Yes, $4,200 represents both a psychological round number and a previous swing high. A decisive break above this level would open the door to the next resistance at $4,221.
Q: Should I buy gold now or wait for a pullback?
A: With the RSI overbought, a pullback toward $4,178–$4,180 offers a better risk‑reward. A stop below $4,167 keeps risk controlled while targeting $4,200–$4,220.
Q: How does an overbought RSI affect my trading?
A: An RSI above 70 warns of possible exhaustion but does not guarantee a reversal. Traders can use it as a signal to tighten stops or wait for confirmation before entering new longs, rather than betting against the trend.
Conclusion
Today’s XAUUSD US session forecast points to a market that remains firmly in the bulls’ camp, yet signs of short‑term fatigue are impossible to ignore. The $4,178–$4,195 range will likely define the session, with a breakout above $4,200 confirming the next leg higher. If the market does pull back, the 50 EMA at $4,167 should act as a strong floor. With fundamentals overwhelmingly supportive, dips are likely to be bought. For traders, the opportunity lies in buying on dips and riding the trend, but patience near resistance is key. Our AI Trading Bot already navigates these exact dynamics 24/7, removing emotion and executing with precision.
Risk Disclaimer: Trading Gold (XAU/USD) involves significant risk of loss. This content is for informational purposes only and does not constitute financial advice. Always conduct your own research and trade responsibly.