XAUUSD US Session Forecast June 10: $4,205 or $4,100?
Gold (XAU/USD) has just staged a dramatic rebound from $4,100 after a cooler-than-expected US CPI report flipped the script on dollar bulls. The $4,205 resistance zone is now the line in the sand for the rest of the New York session. Will it cap the bounce, or is a deeper recovery underway? For traders seeking to automate these moves, our AI Trading Bot scans these levels 24/7 with an 83%+ win rate.
Gold Market Overview
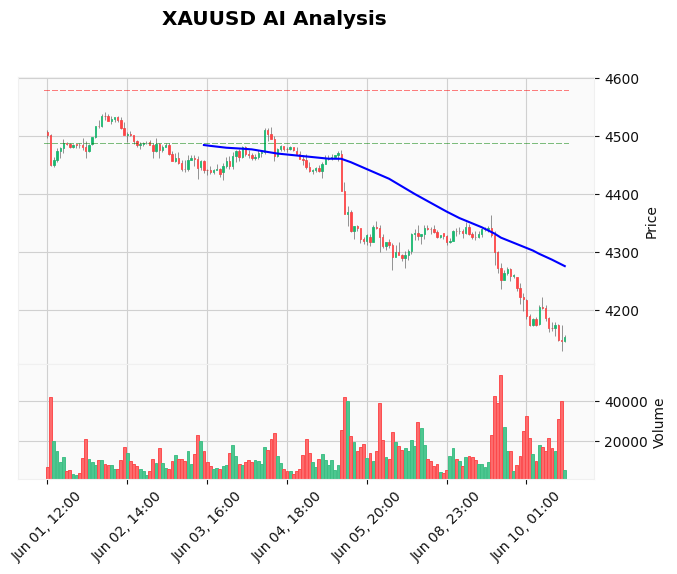
The morning’s US inflation data stunned markets; the CPI print came in below forecasts, cooling the immediate fear of aggressive Fed rate hikes. The US Dollar Index (DXY) dropped 0.3% on the release, providing the catalyst for gold’s $80 intraday pop from the $4,100 support zone. However, the bounce is happening within a well-established bear trend. Earlier this week, XAUUSD broke below the critical $4,200 floor and touched its lowest level since March. The selling was driven by renewed US-Iran geopolitical tensions — ironically, a factor that boosts dollar safe-haven demand and weighs on gold. So while the CPI miss offers a reprieve, the broader macro picture remains dollar-supportive. Traders must keep one eye on the conflict headlines and the other on tomorrow’s PPI report, which is also expected to show easing inflation pressures. For now, sentiment is tentatively bullish for gold in the short term, but the market is far from out of the woods.
Technical Analysis
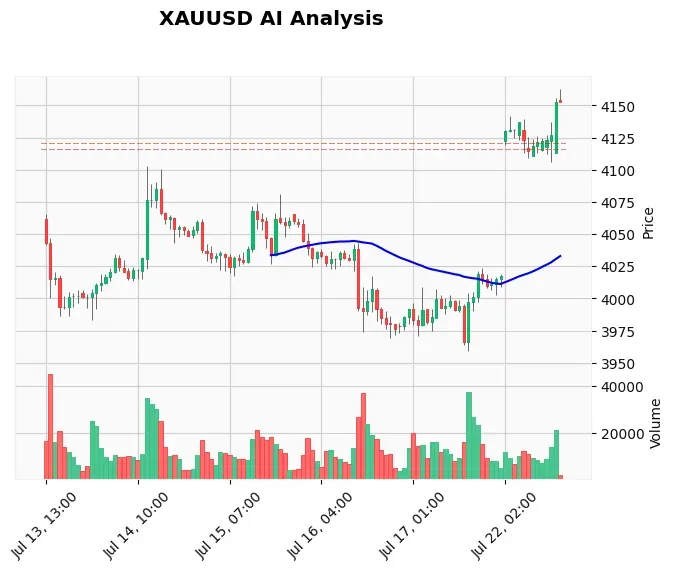
Technically, the landscape is still dominated by bears on the daily chart. The EMA 20 (4,202.69), EMA 50 (4,260.34), and EMA 200 (4,384.16) form a classic bearish alignment, all sloping lower and well above current price. The RSI sits at 38.57, recovering from oversold territory but yet to reclaim 50. MACD remains negative, though the histogram is narrowing, hinting that selling momentum is fading. The sharp V-shaped recovery off $4,100 has brought price into the first resistance cluster: the 4,180-4,205 zone, which aligns with the prior broken support (now resistance) and the 20 EMA. A sustained push above $4,205 would be the first sign that bears are losing control intraday, opening the door to $4,250 (the 50 EMA) and possibly $4,300. On the downside, failure at this resistance could quickly send gold back to $4,150 and then $4,100. The ATR of 26.86 indicates decent volatility, so intraday swings of $20-$30 should be expected. For traders who rely on advanced indicator suites, our Gold technical analysis tools provide real-time support/resistance alerts.
Fundamental Drivers
Today’s CPI release was the main event. The data underscored that the inflation spike was largely fueled by energy prices — specifically gasoline — and not broad-based demand pressures. This eases the urgency for the Fed to hike rates at the next meeting. However, the central bank remains in a hawkish posture, and any hint of persistent services inflation could quickly reverse the dollar’s dip. Meanwhile, US-Iran tensions escalated overnight, with reports of further military posturing. Historically, such conflicts tend to strengthen the dollar as a safe haven, which is why gold struggled to rally despite the geopolitical noise earlier this week. Tomorrow’s PPI report (forecast 0.7% m/m vs. 1.4% prior) will be the next catalyst. A soft reading would reinforce the lower-inflation narrative and could push gold towards $4,250. A hotter print would likely erase today’s gains. The interplay between these opposing forces — a softer inflation outlook versus a dollar buoyed by geopolitical risk — creates a tricky environment where gold could be range-bound between $4,100 and $4,205 in the near term.
Devil’s Advocate
What if the bounce isn’t just a dead-cat bounce? If gold manages to close the US session above $4,205 on strong volume, the technical picture shifts from purely bearish to neutral-bullish for the short term. A break above that level would invalidate the immediate downtrend and could trigger a short squeeze, driving price toward the $4,300 region. In this scenario, traders who stubbornly hold short positions with stops too tight could get run over. The risk is that the combination of a soft CPI and a soft PPI convinces the market the Fed is done hiking, unleashing a wave of dollar selling. Therefore, while the recommended strategy below is to wait for a rejection, we must respect the upside if 4,205 breaks with conviction.
Trading Strategy for This Session
The AI-driven analysis today is clear: WAIT. Cancel any pending short orders near 4,180 because the momentum post-CPI is too strong to fight immediately. Instead, the high-probability setup is to watch for a bearish rejection at the 4,180-4,205 resistance zone. Look for a 1-hour candle close back below 4,180 or a clear pin bar / reversal pattern at the zone. If that materializes, a short entry with a stop loss above 4,220 and a take profit at 4,150 (with a runner to 4,100) offers a favorable 1:3 risk-reward ratio. For those who prefer to capture the momentum, an aggressive long could be taken on a confirmed break above 4,205, targeting 4,250 and 4,280. As always, automation can take the emotion out of this: our News Trading Bot can be configured to place pending breakout orders around exactly these levels during high-impact events.
Risk Management
With an ATR of roughly $27, a stop loss of $40-$50 (1.5–2 times ATR) is appropriate to avoid noise. That puts a stop above 4,220 for shorts and below 4,080 for longs. Risk no more than 2% of your capital on any single trade. If the trade goes against you, accept the loss and wait for the next setup. Many traders compound mistakes by overtrading during news whipsaws. A Windows VPS for Gold trading ensures your platform runs 24/7 without latency, so your stop orders are executed instantly.
FAQ
Why is gold bouncing today despite the bearish trend?
The bounce is a direct result of a weaker US CPI inflation report. Lower inflation reduces the likelihood of aggressive Fed rate hikes, making the dollar less attractive and gold more appealing as a safe haven. However, the daily trend remains bearish as long as price is below the key moving averages.
What is the key level to watch for shorting XAUUSD?
The 4,180-4,205 resistance zone. This is where prior support turns into resistance and the 20-day EMA sits. A rejection here would be an ideal spot to initiate a short with a stop above 4,220.
Will the PPI data tomorrow affect gold?
Yes. PPI measures inflation at the wholesale level. If tomorrow’s PPI comes in lower than the forecast 0.7%, it could reinforce the lower-inflation theme and push gold toward 4,250. A hot number would likely send gold back below 4,180.
Is the bearish trend in gold over?
Not yet. The trend is still bearish on the daily chart with moving averages sloping down. To confirm a reversal, gold would need to close above 4,300 on the daily timeframe. Until then, every rally is a selling opportunity. For real-time trade setups, check our live Gold trading signals.
Conclusion
The US session is at a crossroads. Gold’s breathtaking $80 bounce from $4,100 has injected rare volatility into a market that was decidedly bearish. But the rally is already testing the ceiling at $4,205. A rejection here would be a classic “sell the news” move, pushing gold back toward the lows. A breakout, however, could spark a meaningful short-covering rally. The smart play is to wait for the 1-hour chart to declare its hand. Once it does, pounce with a well-defined risk management plan. For traders who want to mirror institutional-grade strategies without sitting in front of a screen, our Cloud Copy Trading platform lets you automatically copy gold trades from verified experts.
Risk Disclaimer: Trading Gold (XAU/USD) involves significant risk of loss. This content is for informational purposes only and does not constitute financial advice. Always conduct your own research and trade responsibly.