XAUUSD US Session Forecast June 23: Sell $4,125 to $4,075
Gold is trying to bounce from the overnight low of $4,105, but the move looks corrective and offers a fresh short entry. The broader daily trend remains firmly bearish, and the US session opens with a sell‑limit opportunity at $4,125—right into the counter‑trend rally that aligns with both technical structure and fundamental pressure. For traders who want to automate this exact setup, our automated Gold trading bot scans XAU/USD around the clock and executes trades based on the same confluence you see here.
Gold Market Overview
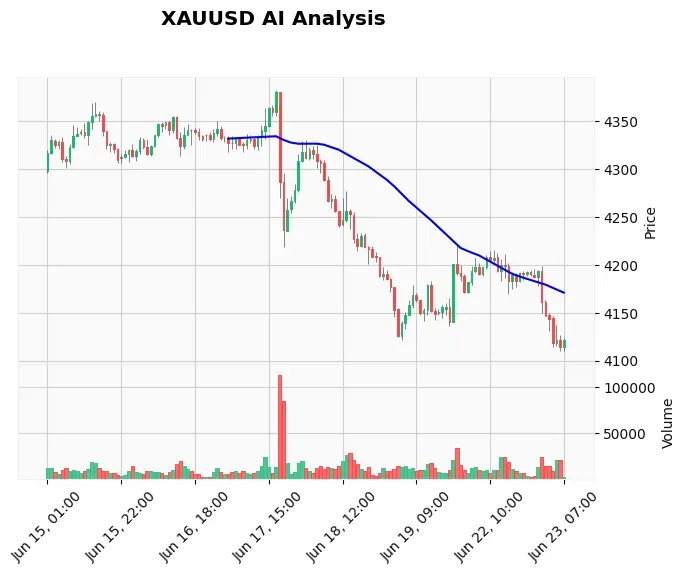
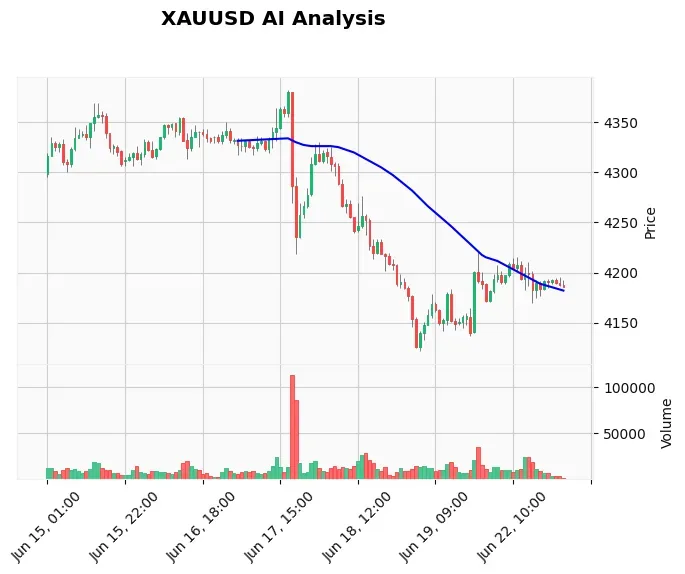
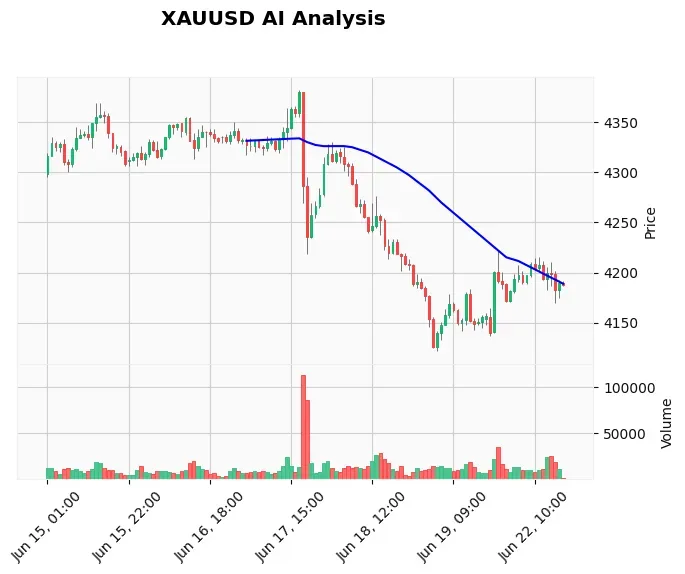
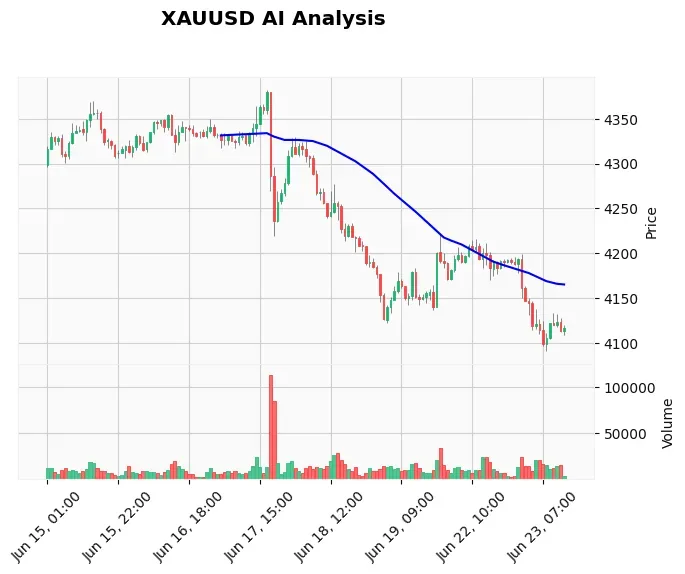
Spot gold is trading at $4,135 as New York comes online, holding just under the 20‑period EMA of $4,140.94. The session opened with a brief recovery from $4,105.29, but the move stalled exactly where the bears wanted it—below the first layer of moving average resistance. The US Dollar Index remains bid on hawkish Federal Reserve expectations, and that dollar strength is the primary anchor dragging gold lower.
Equity futures are under pressure while US yields tick lower, yet the dollar keeps grinding higher. This uncoupling—dollar up, yields down—is a classic “risk‑off‑into‑USD” flow, not a gold‑friendly environment. Traders are pricing in additional rate hikes after the latest dot plot revision, and every bullish gold headline now mentions the $4,000 magnet. Until that narrative shifts, any bounce in XAU/USD should be treated as a selling opportunity.
Technical Analysis
The hourly chart paints a clear bearish picture. Price is below all three key EMAs: the 20 EMA at $4,140.94, the 50 EMA at $4,169.09, and the 200 EMA at $4,240.09. The RSI (45.15) refuses to push above 50, confirming that momentum never truly flipped bullish even during the bounce. MACD sits deep in negative territory at -17.76, and while the histogram is ticking higher, the signal line (-17.12) shows the trend is still controlled by sellers.
Support at $4,121.58 is the immediate floor. If that gives way, the next structural demand zone sits at $4,023.76—coinciding with psychological $4,000. Resistance is stacked: $4,220.98 is the first barrier the bulls need to reclaim just to neutralise the intraday decline, and a move above $4,382.15 would be required to shift the weekly outlook. With an ATR of 20 points, the average true daily range is around $82, meaning a move to the $4,075 target is well within normal volatility.
Fundamental Drivers
The fundamental story is almost monochromatic: a hawkish Fed, a strong dollar, and no bullish catalysts for gold. Markets are still digesting the dot plot that signalled fewer cuts than previously expected, and Treasury yields remain elevated in real terms. A BofA note this morning even suggested that the Fed will “bring down the hammer” with a series of rate hikes later this year—a scenario that would crush gold’s appeal as a non‑yielding asset.
Later this week, two high‑impact US data points will drive volatility: the Core PCE Price Index (forecast 0.3%) and Final GDP (forecast 1.6%), both due in roughly 46 hours. A stronger‑than‑expected PCE print would cement the hawkish narrative and likely push XAU/USD toward the $4,023 support. Geopolitical noise from U.S.–Iran talks has temporarily reduced safe‑haven bids, further weighing on the metal. For news‑driven entries, our automated Gold news bot executes trades directly off high‑impact headlines like these.
Devil’s Advocate
The counter‑argument is that the bounce from $4,105 has some speed, and if gold can close an hourly candle above $4,145—above the 20 EMA—it could spark a short‑squeeze toward $4,170. A surprise miss in the upcoming GDP or a dovish leak from the Fed could also reverse the dollar strength instantly. However, price action has already rejected the 20 EMA on the current hourly candle, and the overall scoring from our AI analysis model heavily favours bears (technical score -0.30, fundamental score -0.70). The path of least resistance is still down.
Trading Strategy for This Session
The optimal play is to let the counter‑trend rally work in your favour. Set a SELL LIMIT at $4,125—a level that catches any final spike before the move fades. Place a stop loss at $4,135, just above the session high and the 20 EMA. The first take‑profit target is $4,075, which offers a 50‑point reward against a 10‑point risk—a 5:1 risk‑to‑reward ratio that absorbs the ATR comfortably. If price triggers and then stalls near $4,121 support, consider trailing the stop to breakeven.
For traders who want the trade managed automatically, our SMC‑powered Gold EA recognises these market structure shifts and can place sell‑limits with dynamic risk management based on real‑time liquidity.
Risk Management
Position sizing is critical in a session where the dollar can jump on any tick of data. With a 20‑point ATR, a sudden 80‑pip spike is a typical Tuesday. Never risk more than 1‑2% of your account on this single idea. If you’re running a bot, make sure it’s hosted on a low‑latency environment; a 24/7 trading VPS ensures orders execute without slippage during high‑volatility windows. Remember, a solid entry means nothing if your platform lags when the market moves.
Frequently Asked Questions
What is the XAUUSD forecast for the US session on June 23?
The forecast is bearish. A sell‑limit at $4,125 targets $4,075, with a stop loss at $4,135. The broader daily trend, backed by a hawkish Fed and strong USD, keeps pressure on gold.
Why is gold falling despite the bounce from $4,105?
The bounce is a corrective move within a downtrend. Gold remains capped below the 20 EMA ($4,140), and the dollar continues to strengthen on rate‑hike expectations. Fundamental data and news headlines reinforce the bearish bias, making any rally a sell opportunity.
What are the key support and resistance levels for gold today?
Support sits at $4,121.58, followed by $4,023.76. Resistance is at $4,220.98, with a major ceiling at $4,382.15. The 20 EMA at $4,140.94 acts as dynamic resistance on the hourly chart.
How should I trade XAUUSD in the US session today?
Look to sell into strength. A sell‑limit at $4,125, stop at $4,135, and take‑profit at $4,075 provides a high‑probability framework. Keep position size small and be ready for volatility around US data releases later this week.
What upcoming US economic data could move gold prices?
The Core PCE Price Index and Final GDP, both due in approximately 46 hours, are the highest‑impact events. A stronger‑than‑expected PCE would likely push gold toward the $4,000 handle.
Conclusion
Gold is giving traders a gift by climbing back to the $4,125 area—right into the sellers’ zone. With the daily trend, the Fed, and the dollar all pointing lower, this setup lines up with a rare confluence of technical and fundamental forces. Use the sell‑limit, keep risk tight, and let the trend do the work. To capture trades like this without staring at the screen, deploy our best‑selling Gold trading bot—it monitors XAU/USD around the clock and executes the same high‑probability setups automatically.
Trading Gold (XAU/USD) involves significant risk of loss. This content is for informational purposes only and does not constitute financial advice. Always conduct your own research and trade responsibly.