XAUUSD European Session Analysis June 18: Bears Control $4,280 – A Make-or-Break Moment for Gold
Gold started the European session on a defensive footing, slipping below the psychological $4,300 mark and trading around $4,288. After an early dip to $4,287, the metal is now testing a critical make-or-break threshold at $4,280. This XAUUSD European session analysis June 18 dissects the technical forces, fundamental catalysts, and high‑probability trade setups as bulls and bears clash at a level that could define the near‑term direction. If you want to execute this setup without staring at charts all day, our AI Trading Bot can manage the entry, stop, and target automatically with a proven 83%+ win rate on XAU/USD.
Gold Market Overview: A Range‑Bound Start With a Bearish Tilt
Gold entered the European morning under the weight of a slightly firmer US dollar and lingering hawkish Fed repricing. The DXY edged higher, while US 10‑year yields clung to recent gains, making the non‑yielding metal less attractive. Overnight, Asian trading saw a modest recovery from the daily low, but that bounce failed to recapture $4,300, leaving sellers in control.
Market participants are navigating a landscape of mixed signals. The Federal Reserve’s June hold was accompanied by a dot‑plot recalibration that pushed December hike odds towards 50%, according to InvestingLive analysis. At the same time, no high‑impact US economic releases are due today, which typically allows gold to carve its own path technically. Still, the broader caution around Trump‑era fiscal uncertainties and the upcoming Fed path keeps gold within a range, with a clear downside bias for the moment.
For European traders, this environment demands agility. The absence of headline risk means price action and key technical levels will dominate, but any surprise Fed‑speak or sudden move in the dollar could trigger sharp intraday swings. The metal is essentially trapped between an intraday downtrend and a still‑intact weekly uptrend, creating a tension that traders must respect.
Technical Analysis: Bears Tighten Grip Below EMAs
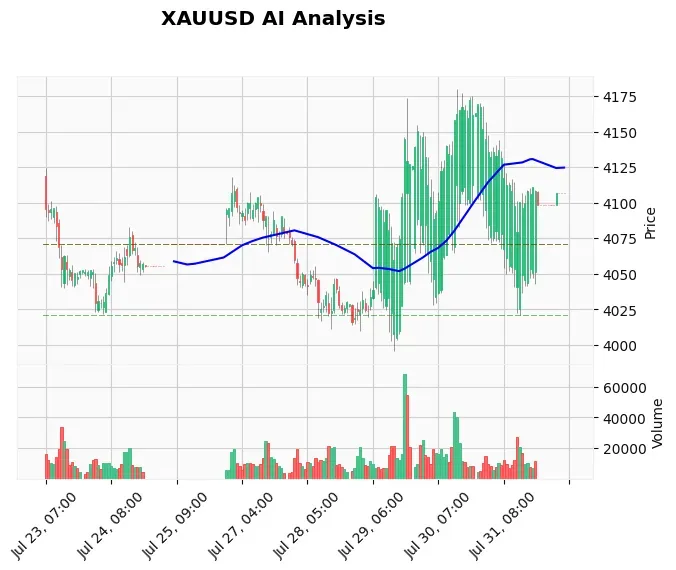
The 60‑minute chart paints a clear technical picture. Price closed the Asian session at $4,288.83, well below the 20‑period, 50‑period and 200‑period exponential moving averages, which are stacked at $4,309.71, $4,313.03 and $4,308.15 respectively. A bearish EMA alignment plus a close beneath them is a classic trend‑continuation signal for the short side.
Momentum oscillators support the bearish case. The RSI sits at 43.13, below the 50 midline, indicating sellers hold the upper hand without being oversold. The MACD remains deeply negative at -6.81, with the signal line at -6.90 – a configuration that has not yet shown a bullish crossover. The ATR of 23.38 points to solid intraday volatility, meaning stops need to be placed wide enough to avoid being prematurely taken out by noise.
Key levels derived from the latest webhook data place immediate downside support at $4,268.53 (S2), with a more distant S1 at $4,023.76 that is unlikely to be tested today. On the upside, resistance stands at $4,369.24 (R1) and $4,363.54 (R2), though these are far off from the current price. More relevant is the psychological $4,300 level and the zone between $4,305 and $4,310, where the buy‑stop order from our AI analysis sits. A break above $4,305 would invalidate the bearish bias and trigger a swift move toward $4,320.
A chart of the hourly structure confirms that gold has been respecting an intraday descending channel since yesterday’s New York close, with a lower high at $4,309.48 and a lower low at $4,287.31. The $4,280 region is the next logical support, aligning with the channel bottom and the 61.8% Fibonacci retracement of the last swing. Should that floor break, a quick drop to $4,268.53 is the most likely scenario.
Fundamental Drivers: Hawkish Fed Caps Recovery, but No Fireworks Today
The fundamental backdrop is defined by the post‑FOMC hangover. Deutsche Bank noted earlier today that “the hawkish Fed repricing and stronger Dollar pressured Gold prices,” a theme that continues to weigh. At the same time, the intraday positive bias observed during the Asian session – gold rebounded from $4,287 to near $4,300 – suggests dip‑buyers are still active, especially as long as the metal stays above $4,280.
On the geopolitical front, tensions surrounding Iran and the ongoing war’s impact on German growth (as flagged by IMK) add a mild safe‑haven demand, but that has been offset by risk‑asset resilience. The PBOC’s reference rate fix at 6.8130 vs. an estimate of 6.7752 – a slightly weaker yuan – indirectly supports the dollar, adding a headwind for gold. Importantly, there are no major US economic releases today, leaving the market to digest Friday’s Fed rhetoric and perhaps positioning ahead of next week’s housing data.
For traders relying on news-driven moves, our News Trading Bot automates entries based on high‑impact events, capturing the sharp spikes that often occur immediately after US releases.
Devil’s Advocate: Why Gold Could Reverse and Squeeze Shorts
The bearish setup is not without counterarguments. The weekly chart still shows a long‑term uptrend, and the price is hovering just above the psychological $4,300 area where buyers have previously stepped in. The AI signal management status remains “CONTINUE” with a pending BUY stop at $4,305, meaning that as soon as momentum flips above that level, the market could see a cascade of stop‑running that propels gold back to $4,320 or even $4,350.
If the US dollar retreats on profit‑taking or if a surprise dovish comment emerges from a Fed official, the technical picture could rapidly shift. The EMA cluster near $4,310 would then act as a magnet. Any daily close back above the 200‑period EMA would likely trigger a broader reversal and force short‑covering, making the $4,305–$4,310 zone the true line in the sand. Therefore, aggressive shorts must be careful; a failure to break $4,280 could invite a sharp snap‑back rally.
Trading Strategy for This Session
Given the technical alignment and the absence of high‑impact news, the European session favours a tactical short approach while respecting the make‑or‑break level. A sell entry on a retest of the $4,300–$4,305 zone with a stop above $4,320 offers a favourable risk‑reward. Alternatively, a break of $4,280 with confirmed selling pressure could be sold on the retest of that level, targeting $4,268.50.
For traders seeking an automated execution, Price Action Pro EA can scan for the exact break of $4,280 and place orders with dynamic stops based on recent volatility – ideal for this type of structural trade.
On the flip side, the buy‑stop order at $4,305 with a stop at $4,293 and take profit at $4,320 remains viable for those who believe the weekly uptrend will reassert itself. Seasoned traders can maintain both orders simultaneously, letting the market decide the direction. Whichever side you take, ensure your exposure is controlled.
Risk Management: Size for the ATR and Respect Key Levels
With an ATR of 23.38, intraday swings of over $20 are common. Place your stop at least 1.5 times the ATR beyond your entry to avoid being stopped out by noise. In the short trade mentioned, a stop at $4,320 would be about $20 above the entry zone, appropriate for the volatility. Position sizing should reflect no more than 1‑2% risk per trade.
If the trade fails, do not chase. A sustained move above $4,305 invalidates the bearish view; in that case, cutting losses and flipping to a long bias is the disciplined approach. A Windows VPS for Gold trading ensures your orders execute instantly with zero downtime, especially critical during London volatility spikes.
FAQ
Q: What is the critical support level for XAUUSD on June 18?
A: The most important support today is $4,280. A sustained break below that level would open the door to $4,268.53, the next structural floor. As long as gold holds above $4,280, bulls have a chance to regain control.
Q: Why is gold falling despite no major US news?
A: Gold is pressured by a hawkish Fed repricing and a firmer US dollar, which gained traction after the June FOMC meeting. Even without high‑impact events, the technical bias is bearish, and traders are reacting to the shift in rate expectations.
Q: Can gold recover above $4,300 in the European session?
A: Yes, a recovery is possible if buyers defend the $4,280 area and/or the dollar retreats. A break above $4,305 would signal a bullish momentum shift, targeting $4,320. The buy‑stop order at that level confirms that institutional algos are watching it closely.
Q: Should I trade the short side or wait for a reversal?
A: The safest approach in the current environment is to let the market prove itself. Place both a sell order below $4,280 and a buy stop above $4,305. This “bracket” strategy capitalizes on whichever direction wins, avoiding the risk of guessing prematurely.
Conclusion: $4,280 Holds the Key to the Next $30 Move
This XAUUSD European session analysis June 18 reveals a gold market perched on a knife’s edge. Bears are in control beneath the EMA cluster, but they must crack $4,280 to extend the decline significantly. Should that level break, $4,268.50 is the immediate target. Conversely, a rejection of $4,280 and a push back above $4,305 would flip the script in favour of bulls. The safe play is to wait for the market to decide, using pending orders around these levels. Our AI Trading Bot is built exactly for this kind of environment – it monitors price around the clock and executes with discipline, removing emotional bias from the equation.
Trading Gold (XAU/USD) involves significant risk of loss. This content is for informational purposes only and does not constitute financial advice. Always conduct your own research and trade responsibly.