XAUUSD European Session Analysis April 10: $4,730 Pivot in Focus Ahead of CPI
Gold price action is stuck in a holding pattern at $4,749 during the European session on April 10, 2026, as traders brace for the impending US CPI data release. The XAUUSD European session analysis April 10 reveals a market caught between a primary bullish trend and the immediate, asymmetric risk of a hot inflation print. The critical $4,730 support zone is the technical line in the sand; a break here could accelerate a sell-off towards $4,698. Want to navigate this high-stakes volatility with precision? Our AI Trading Bot executes 24/7 on XAU/USD using quantified risk parameters, removing emotional decision-making during news events.
Gold Market Overview
Sentiment is decidedly cautious in the European session. The US Dollar holds a firm bid, pressuring gold as the clock counts down to the 12:30 UTC CPI release. The forecast is unequivocally concerning for gold bulls: headline CPI year-over-year is expected to surge to 3.4% from 2.4%, a significant reacceleration of inflation. This data point has the power to dramatically reshape Federal Reserve rate cut expectations, potentially reviving hawkish pricing and boosting real yields—a classic headwind for non-yielding gold. Geopolitical tensions, primarily centered on Iran, provide a underlying bid for safe-haven assets, but this support is being overshadowed by the pre-event positioning. The price is currently trapped between the daily trend’s bullish inertia and the session’s bearish fundamental catalyst.
Technical Analysis
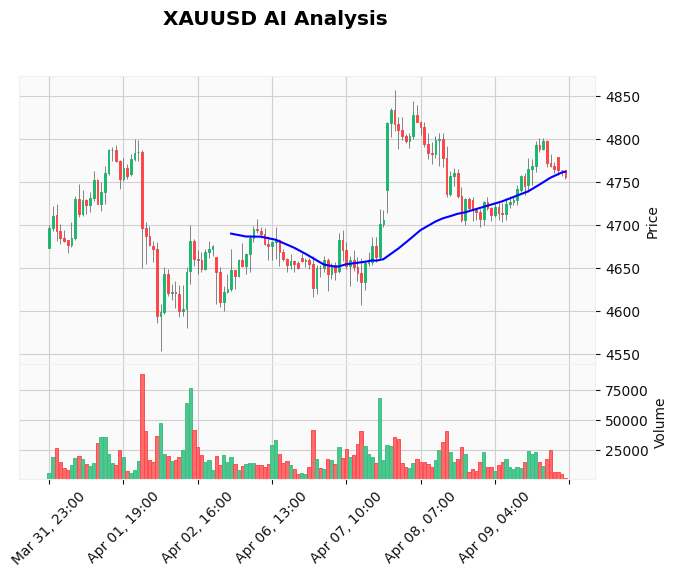
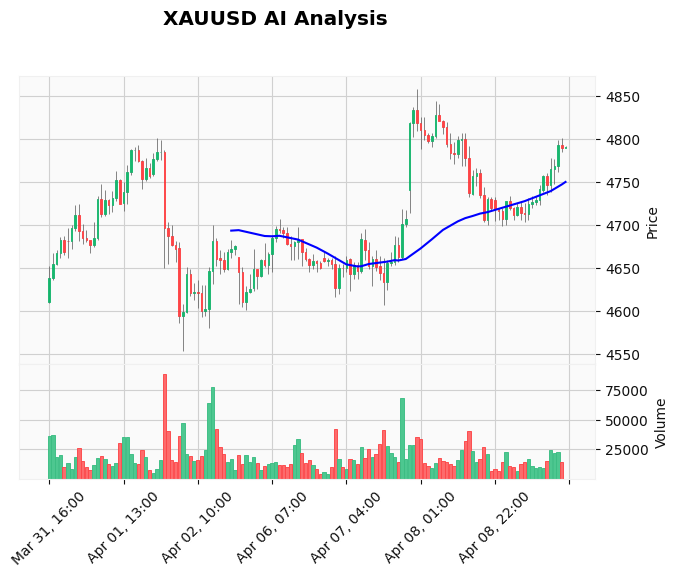
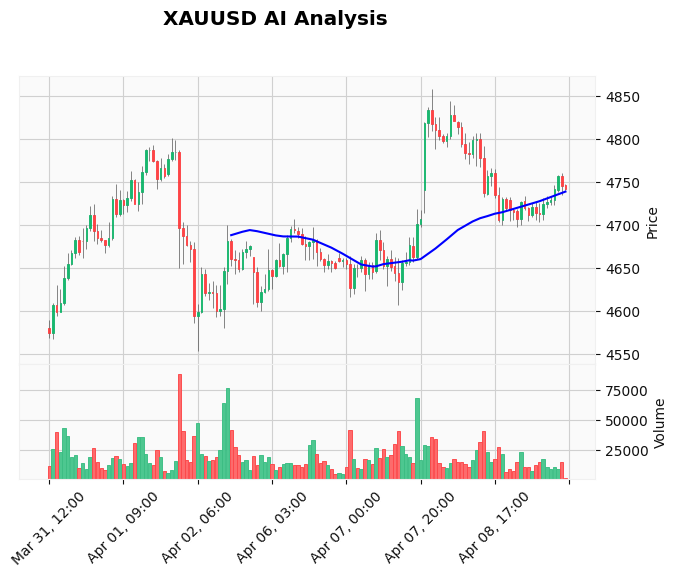
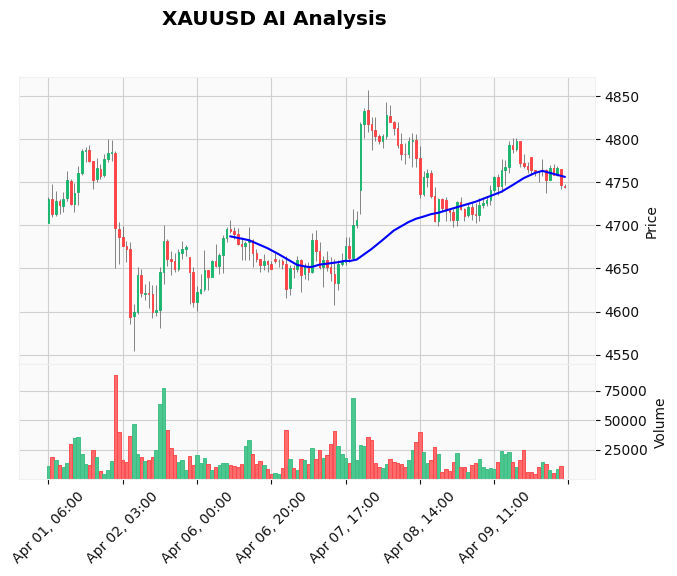
The technical picture shows a market in consolidation ahead of a potential catalyst. The daily chart structure remains bullish, with price well above the key EMA 200 at $4,690. However, the shorter-term dynamics are weakening. Price is currently testing the EMA 50 at $4,747.4 and sits just below the EMA 20 at $4,758.08, indicating near-term bearish pressure. The RSI at 47.27 is neutral but with a bearish slope, while the MACD histogram is positive but below its signal line, suggesting bullish momentum is waning. The critical support to watch, as identified in our AI log, is the $4,720-$4,730 consolidation zone. A decisive break below $4,730 would open a path toward the stronger webhook support at $4,698.47. Immediate resistance is clustered between $4,757 (session high) and $4,760.
Fundamental Drivers
All fundamental roads lead to the US Consumer Price Index for March. The consensus forecast of 3.4% y/y, if realized, would represent the hottest reading in over a year and severely challenge the market's narrative of persistent disinflation. Such a print would force a repricing of the Fed's dot plot, potentially pushing the first rate cut into late 2026 or off the table entirely. This is a pure USD-positive, gold-negative event. The secondary driver is geopolitical risk, with markets monitoring US-Iran peace talks. A successful de-escalation could remove a key safe-haven pillar for gold, while a breakdown could spark a volatility spike. Trading this event manually is high-risk. Our News Trading Bot is specifically engineered to parse the headline, quantify the deviation from forecast, and execute trades within milliseconds, a clear edge in these environments.
Devil's Advocate
The bullish case rests on a potential "buy the rumor, sell the fact" dynamic or a CPI miss. Markets may have already priced in a hot number, and any figure at or below consensus could trigger a short-covering rally in gold as USD longs exit. Furthermore, the underlying geopolitical and central bank buying trends remain structurally supportive. The key level that would invalidate the immediate bearish threat is a sustained break above the EMA 20 at $4,758, which would signal that the selling pressure has been absorbed and the primary uptrend is resuming.
Trading Strategy for This Session
The prudent strategy is to wait for the CPI release and assess the price reaction at key levels. Aggressive traders might consider a breakout setup. A confirmed break and close below $4,730 support could target a move to $4,698, with a stop above $4,745. Conversely, a bounce from $4,730 that pushes price above $4,760 could signal a continuation of the uptrend, targeting the $4,785 area. Given the volatility, position sizing must be conservative. For traders who prefer a systematic approach, our Price Action Pro EA identifies and trades such breakout patterns on the H1 and H4 charts automatically, adhering to strict risk rules.
Risk Management
This is a classic high-impact news trade. Risk no more than 1-2% of your account on any single position entered around the event. Use a minimum 1:1.5 risk-reward ratio. If you are not in a trade before the news, consider waiting for the initial volatility spike to settle and a new range to establish—often the smarter play. Always have a predetermined stop loss and stick to it. To ensure your trades run 24/7 without interruption, consider a low-latency Windows VPS for Gold trading.
Frequently Asked Questions (FAQ)
Q: What time is the US CPI release today and why is it so important for gold?
A: The US CPI data for March is scheduled for release at 12:30 UTC on April 10. It's critical because inflation directly influences Federal Reserve interest rate policy. A higher-than-expected print (like the 3.4% forecast) reduces the likelihood of near-term rate cuts, strengthening the US Dollar and typically pressuring gold prices, as seen in the current cautious trade around $4,749.
Q: What is the key support level for XAUUSD in the European session?
A: The most immediate and critical support zone is between $4,720 and $4,730, based on previous consolidation. A daily close below this area, particularly the $4,730 pivot, would signal a breakdown and could trigger a deeper pullback towards the $4,698 support level.
Q: If the CPI data is lower than expected, where could gold price go?
A: A cooler-than-forecast CPI print (e.g., at or below 3.0%) would likely cause a sharp drop in the US Dollar and a rally in gold. In this scenario, the first target would be a break above the EMA 20 at $4,758, with a potential run towards the $4,785-$4,800 resistance zone.
Q: Should I trade gold before or after the CPI news?
A: For most retail traders, the safest approach is to wait for the news release, let the initial extreme volatility pass (usually 2-5 minutes), and then trade the confirmed direction once price establishes a new level of support or resistance. Trying to guess the outcome is high-risk gambling.
Conclusion
The European session is defined by anticipation. The technical and fundamental narratives are in direct conflict: the bull trend versus the CPI risk. The $4,730 level is the session's battleground. A hold here keeps the bullish structure intact for a post-news rally, while a failure opens the door for a swift corrective move. Regardless of the outcome, having a disciplined, rules-based approach is paramount. Let our best-selling Gold trading bot handle the execution, leveraging its 83% win rate algorithm to trade the volatility while you manage the strategy.
Risk Disclaimer: Trading Gold (XAU/USD) involves significant risk of loss. This content is for informational purposes only and does not constitute financial advice. Always conduct your own research and trade responsibly.