XAUUSD European Session Analysis June 08: $4,300 Level Cracks
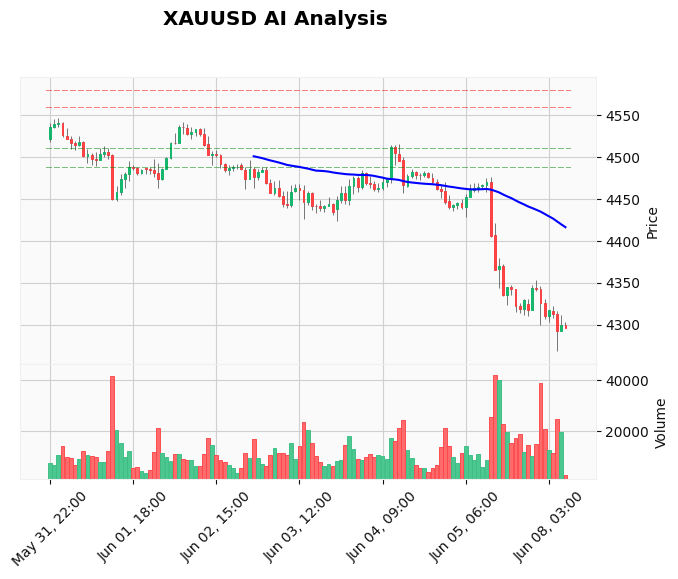
XAUUSD European session analysis June 08 reveals that gold has crumpled under the weight of a surging US dollar, breaking below the $4,300 psychological barrier and plunging to $4,294.57—a level not seen since late March. The European session kicked off with aggressive selling as traders digested robust US jobs data and Goldman Sachs’ decision to delay Fed rate cuts to 2027. The break of $4,300 has triggered a cascade of technical stop losses, accelerating the decline and reinforcing the bearish outlook. With the DXY firmly bid and Treasury yields climbing, gold traders are facing a one-sided tape today. Our AI analysis confirms the momentum-driven short bias, with a live sell signal already active at $4,296. For those who want to trade this setup automatically, our best-selling Gold trading bot runs 24/7, capturing moves like this with surgical precision.
Gold Market Overview
The XAU/USD pair is trapped in a powerful bearish wave, hammered by a combination of technical breakdown and fundamental headwinds. The US Dollar Index remains elevated above 105.50, while the 10-year Treasury yield edges higher, making non-yielding assets like gold deeply unattractive. Market sentiment has pivoted aggressively toward a "higher for longer" rate environment after last week’s stellar NFP report surprised to the upside. Goldman Sachs’ revised forecast—pushing the first rate cut to 2027—has vaporized any lingering hopes of near-term monetary easing, reinforcing the dollar’s dominance.
The upcoming Core CPI release (forecast at 2.9% y/y vs. 2.8% prior) adds another layer of pressure; a hotter print would likely cement another round of USD buying and send gold toward the next support zone. Meanwhile, safe-haven demand remains muted as Middle East tensions fail to offset the macro-driven sell-off. In this environment, gold offers little refuge for bulls.
Technical Analysis
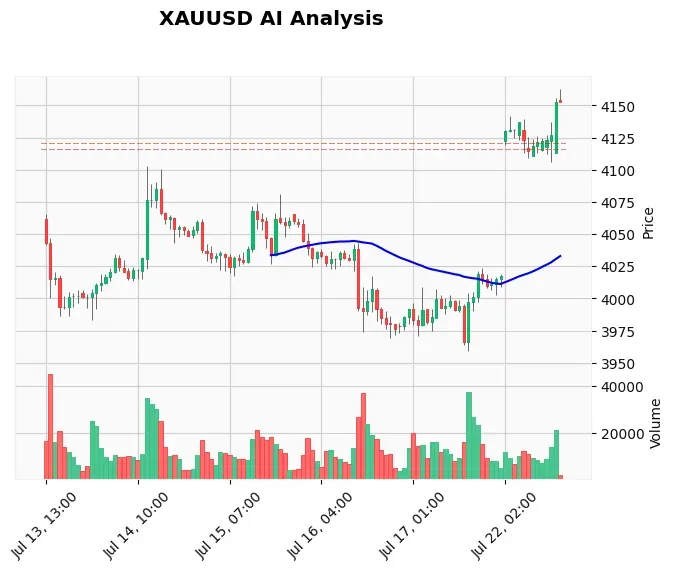
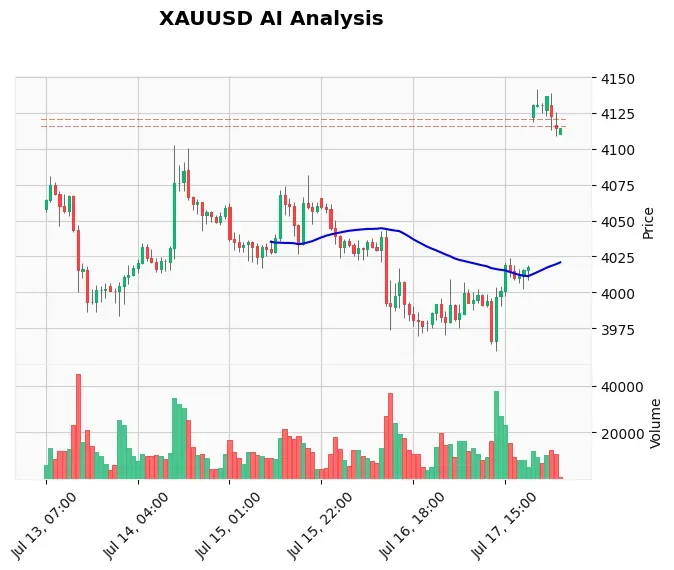
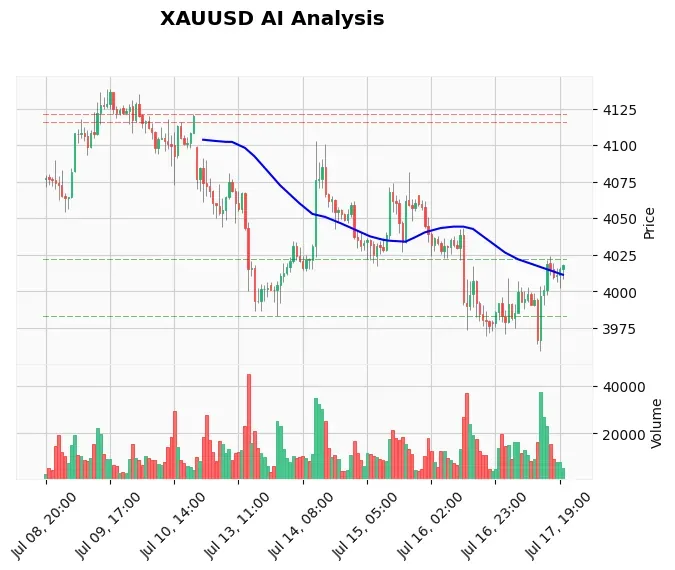
From a technical standpoint, the damage is severe. Price now trades well below all key moving averages: the 20-EMA at 4340.73, the 50-EMA at 4391.95, and the 200-EMA at 4463.28. This bearish alignment leaves no doubt that the path of least resistance points lower. On the 1-hour chart, the RSI has plummeted to 29.32, deeply oversold, yet such momentum signals more than just a temporary dip—they indicate strength behind the selling. MACD prints at -34.81 against a signal line of -34.20, with the histogram expanding lower, confirming accelerating downside pressure.
Average True Range (ATR) sits at 23.55, suggesting intraday swings of around $20-$25. That means the bearish move could extend quickly if the $4,280 floor is tested. Key levels to watch: immediate resistance now at $4,314 (the previous swing area), followed by $4,335. On the downside, the first meaningful support rests at $4,280—the March swing low—with a secondary target at $4,250. A break below $4,280 would open the door to the $4,240 region where a cluster of previous reaction points awaits.
Fundamental Drivers
Last Friday’s blowout US jobs report triggered a seismic shift in Fed expectations. Nonfarm payrolls crushed estimates, pushing Goldman Sachs to abandon its 2026 rate-cut call entirely and now forecast the first cut in 2027. This hawkish repricing crushed gold, which yields nothing, and sent the dollar flying. The strong labor market, coupled with stubborn inflation, suggests the FOMC will remain on hold for an extended period—exactly the scenario gold hates.
With the highly anticipated Core CPI figures just over 50 hours away, traders are positioning for another potential upside surprise. A print of 2.9% or higher would likely ignite another wave of USD buying and spell further trouble for XAU/USD. For those who want to trade news events with lightning speed, the News Trading Bot executes trades milliseconds after high-impact releases, capturing explosive moves before manual traders can react.
Devil’s Advocate
No trade is a one-way street. If the US CPI data comes in cooler than expected, the dollar could reverse sharply, sparking a fierce short squeeze in gold back toward $4,314–$4,335. Additionally, if Middle East geopolitical tensions escalate to a boiling point, safe-haven flows could temporarily overshadow the macro backdrop and lift gold above $4,300. A daily close back above $4,310 would invalidate the immediate bearish bias and signal a broader correction.
Trading Strategy for This Session
Given the momentum and the freshly broken $4,300 floor, selling into any minor retracements or at market remains the preferred play. Our AI-driven signal recommends a market sell entry around $4,296, with a stop loss placed just above the psychological level at $4,310. On the profit side, we anticipate a swift probe of $4,280, followed by $4,260 and ultimately $4,240 where structural support resides. This three-tiered target approach lets you lock in partial profits while leaving runners for the extended drop.
For traders who prefer a fully automated approach based on Smart Money Concepts, the Price Action Pro EA deciphers order blocks and liquidity grabs on XAUUSD, executing entries with zero emotional interference.
Risk Management
A 13.66-point stop above $4,310 gives plenty of room above the broken support-turned-resistance. Position size should be calibrated so that the stop represents no more than 2% of account equity. The risk-reward profile on this setup is compelling: even the first target at $4,280 offers a 1:1.2 ratio, and if TP3 hits at $4,240, the ratio stretches beyond 1:4. If the trade goes against you, accept the loss and wait for a confirmed reclaim of $4,300 before considering a bullish reversal.
FAQ
Why is gold falling today?
Gold is under heavy selling pressure because the US dollar is rallying on hawkish Federal Reserve expectations. Strong jobs data prompted Goldman Sachs to push rate cuts to 2027, slashing gold’s appeal as a non-yielding asset.
What are the next support levels for XAUUSD?
Immediate support lies at $4,280, the March swing low. Below that, $4,250 and $4,240 serve as the next downside magnets where buying pressure could emerge.
How does US CPI affect gold prices?
A higher-than-expected CPI reading typically strengthens the USD and sends gold lower because it reduces the chances of Fed rate cuts. Conversely, a soft print could trigger a gold relief rally.
Is it safe to short gold below $4,300?
While no trade is risk-free, the technical breakdown below $4,300 combined with strong fundamental headwinds creates a high-probability short environment. Using a tight stop above $4,310 and proper position sizing keeps risk controlled.
Conclusion
The story for gold in this European session is unambiguous: bears are in charge, and the $4,300 floor has given way. With the DXY flexing its muscles and rate-cut hopes vanishing, XAU/USD has little reason to bounce. The $4,280 support is the immediate line in the sand, and a break there could accelerate the decline toward $4,240. Traders should stay short-biased, manage risk tightly, and let the momentum do the heavy lifting. To exploit these fast-moving markets without constant screen watching, our AI-powered XAU/USD bot runs around the clock, executing high-probability setups with an 83%+ win rate.
Risk Disclaimer: Trading Gold (XAU/USD) involves significant risk of loss. This content is for informational purposes only and does not constitute financial advice. Always conduct your own research and trade responsibly.