XAUUSD European Session Analysis June 11: Bears Hold $4,130
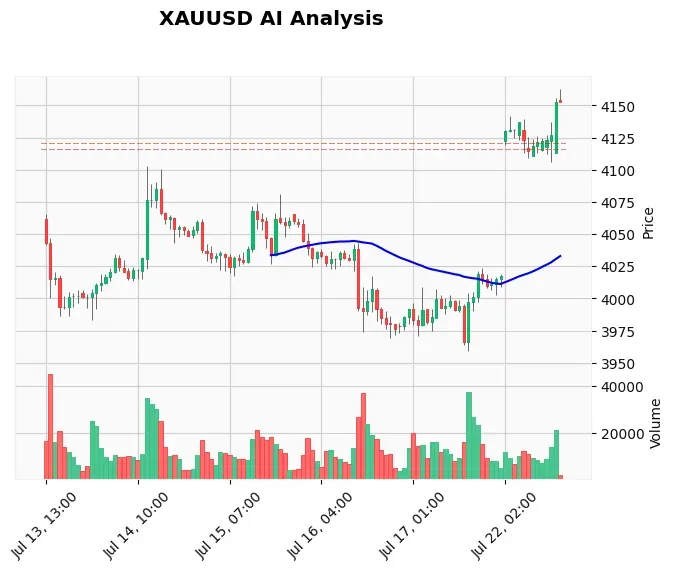
The European session is painting a mixed picture for gold traders. XAU/USD is hovering at $4,104, trapped between a corrective bounce from the 2026 low and the weight of a hawkish Federal Reserve. Our systems have just cancelled the pending sell limit at $4,110 because the M15 chart is showing a dangerous surge in buying momentum. With the US Producer Price Index release just hours away, the smart play is to wait. If you want to automate such high-risk decisions, our AI Trading Bot runs 24/7 on XAU/USD with an 83%+ win rate.
Gold Market Overview
Gold is struggling to mount a meaningful recovery after yesterday’s sharp drop to $4,024, the lowest since November 2025. The US dollar remains firm as traders cling to the idea that the Fed will keep rates elevated for longer, reinforced by the hotter-than-expected CPI numbers earlier this week. US-Iran airstrikes are adding a layer of geopolitical nervousness, but for now, safe-haven demand is being overshadowed by the interest-rate narrative. Yields are climbing, oil is volatile, and gold is caught in the crossfire. The PPI report due at 13:30 BST will be the pivot – a cool number could soften the dollar and give gold room to run, while another upside surprise would pile fresh pressure on the yellow metal.
Technical Analysis
The hourly chart remains structurally bearish. Price is trading below all three major EMAs: the 20-period EMA at $4,108.54, the 50 EMA at $4,175.61, and the 200 EMA at $4,338.13. The RSI sits at 44.49, not yet oversold but pointing to weak momentum. MACD is deeply negative (-29.41) and still below its signal line, confirming downward pressure. The daily ATR of $29.48 tells us that sharp 30-dollar swings are normal, which makes tight stops extremely risky ahead of news.
Key levels to watch are far more local than the wide weekly pivots. Immediate resistance is the $4,110–$4,130 zone, the same area where we had our cancelled sell order. Above that, the 20 EMA at $4,108–$4,110 is acting as a near-term lid. On the downside, $4,080 is the first critical floor, followed by the psychological $4,000 handle and the YTD low at $4,024. A close below $4,080 would signal another leg towards the March lows.
Fundamental Drivers
All eyes are on the US PPI release. Core PPI is forecast to cool to 0.5% m/m from 1.0%, and headline PPI to 0.7% from 1.4%. Softer numbers would back the “peak inflation” narrative and could trigger a dollar sell-off, lifting gold. However, the market is still digesting the previous CPI shock and the uptick in Fed terminal rate expectations. If PPI prints hot, rate-hike bets will surge, likely sending gold back toward $4,000. Traders should also monitor the ongoing US-Iran conflict; any escalation or ceasefire headline could cause sharp intraday moves. To capitalize on these sudden news spikes, our News Trading Bot is engineered to trade high-impact events on XAU/USD with precision.
Devil's Advocate
What if PPI data comes in well below forecasts? The M15 surge we are seeing right now could be front-running a bullish outcome. A sustained break above $4,130 would invalidate the immediate bearish structure and open the door to $4,175 (50 EMA) and even $4,200. The key invalidation for bears is a 1-hour close above the $4,130 resistance zone. If that happens with news-fueled volume, the short-term bias flips to neutral-to-bullish. Aggressive sellers who entered prematurely could face a nasty squeeze.
Trading Strategy for This Session
We are in full wait-and-see mode. The AI model has cancelled the sell limit at $4,110 because the risk/reward deteriorated. The optimal approach is to stand aside until after the PPI release. If you must trade, consider a sell-stop below $4,078 once the data dust settles, targeting $4,040. Alternatively, a buy-stop above $4,132 with a tight stop could catch a breakout. For traders who prefer fully automated execution, our Price Action Pro EA can manage such risk-sensitive entries without emotion.
Risk Management
PPI events regularly move gold $30–$50 in seconds. Position sizing must be conservative – risk only 0.5–1% of your account on any single trade. If you choose to place pending orders, make sure they are far enough from the expected volatility so that slippage doesn’t eat your stop loss. A risk-reward ratio of at least 1:2 is still possible, but only after the first violent swing has passed. Remember, the best trade is sometimes no trade.
FAQ
Is gold bullish or bearish today?
Intraday bias is bearish below $4,130. The EMA stack and MACD continue to favour sellers. However, a dovish PPI surprise could quickly flip the sentiment.
What is the next gold target?
If bears hold $4,130, the next downside target is $4,080, followed by $4,040. A break above $4,130 would target $4,175 initially.
Why was the sell order at $4,110 cancelled?
The M15 chart showed a strong bullish momentum surge, increasing the probability of a breakout above the $4,110–$4,130 resistance area. With PPI ahead, the stop loss at $4,130 became too vulnerable.
Should I trade gold before the PPI release?
It is not recommended. Liquidity thins and spreads widen before high-impact data. Waiting for the release and the first 15-minute reaction is the safer approach.
Conclusion
The $4,130 level is now the line in the sand. Gold has a bearish structure but a short-term bullish undercurrent that makes blindly selling dangerous. The European session is one of patience. Once the PPI clears, we will reassess with fresh data. Discipline during news events separates profitable traders from gamblers. For those who want to trade fearlessly, let our AI Trading Bot handle the heavy lifting – it never hesitates, never doubts, and runs 24/7 on XAU/USD.
Trading Gold (XAU/USD) involves significant risk of loss. This content is for informational purposes only and does not constitute financial advice. Always conduct your own research and trade responsibly.